Dual Mode Atomic Force Microscopy and Interferometric Scattering Imaging of Single Au@Fe3O4 Nanoshell Synthesized for Biomedical Applications
Mohammad E Khosroshahi, Lida Ghazanfari and Zahra Hasannejad
DOI10.21767/2471-9838.100022
Mohammad E Khosroshahi1-3*, Lida Ghazanfari1,4 and Zahra Hasannejad1,5
1Laser and Nanobiophotonics Laboratory, Biomaterial Group, Faculty of Biomedical Engineering, Amirkabir University of Technology, Tehran, Iran
2MIS-Electronics, Nanobiophotonics and Biomedical Research Lab, Richmond Hill, ON L4B 1B4, Canada
3Department of Mechanical and Industrial Engineering, University of Toronto, Ontario M5S 3G8, Canada
4Eshelman School of Pharmacy, University of North Carolina-Chapel Hill 27599-7362, USA
5Sina Trauma and Surgery Research Center, Tehran University Medical Sciences, Tehran, Iran
- *Corresponding Author:
- Mohammad E Khosroshahi
MIS-Electronics, Nanobiophotonics and
Biomedical Research Lab, Richmond Hill
ON L4B 1B4, Canada
Tel: 1-416-978-1287
E-mail: khosrom@mie.utoronto.ca
Received date: August 01, 2017; Accepted date: August 22, 2017; Published date: August 25, 2017
Citation: Khosroshahi ME, Ghazanfari L, Hasannejad Z (2017) Dual Mode Atomic Force Microscopy and Interferometric Scattering Imaging of Single Au@Fe3O4 Nanoshell Synthesized for Biomedical Applications. Nano Res Appl. Vol. 3 No. 2:5. doi:10.21767/2471-9838.100022
Abstract
Imaging based on interferometric scattering (iSCAT) enhances the accuracy and temporal resolution in comparison to single-emitter-based techniques. In this research, we describe a combined method, which measures the size of individual magneto plasmonic Nano shells (MPNSs). The maghemite (Fe3O4) nanoparticles (SPIONs) with core diameter of 9.5 nm ± 1.4 nm is prepared by co-precipitation and coated by gold. The final dimension of polyvinyl pyrrolidine (PVP) stabilized MPNSs are 15.8 nm ± 3.5 nm measured by TEM. UV-Vis spectrophotometer and vibrating sample magnetometer (VSM) were used to study the optical and magnetization properties. The size of these nanoshells is determined independently by correlating their iSCAT and atomic force microscopy (AFM) images. By analyzing the number of single MPNSs, an interference intensity distribution is obtained with a nominal diameter of 15.8 nm in agreement with the size distribution recorded by TEM. It seems, the combination of iScat and AFM is capable of producing high resolution images of individual nanoparticles.
Keywords
Gold nanoshell; Optical imaging; Correlative Microscope; iScat; AFM
Introduction
Currently, there is a great interest in the development of nanoparticles that combine multiple functions or properties not obtainable in homogeneous bulk materials. Recent advances in nanoengineering enables different moieties to be integrated into a single carrier with controlled optical and magnetic properties which in turn can be utilized for variety of interesting biomedical applications [1]. Unique to gold Nanoshells (AuNSs), is their Localized Surface Plasmon Resonance (LSPR) which greatly intensifies their interaction with the electromagnetic ÃÆïÃâìÃâÃÂeld at the metal surface. Based on the Mie theory one can expect to achieve a tunable nano system by varying the core-shell ratio, ranging from visible to the near infrared using different shape and size of Nanoshell [2]. Other significant factors when considering AuNSs include their biocompatibility because of inert surface, nontoxicity, surface chemistry i.e., they can be conjugated by specific ligands for targeting, imaging and therapies, absence of photobleaching or blinking as it is observed in the case of quantum dots, and very low oxidation [3,4]. As a result, AuNPs and equally AuNSs have been extensively used in applications like bioimaging [5,6] mainly due to their ability to convert absorbed light into heat (i.e., photothermal efficiency). Other aspect of MPNSs is due to presence of iron oxide core which enables them to move under direct controlled and influence of external magnetic field, thus can be easily used in applications such as guided drug delivery.
Studying microscopic dynamical process by single particle or an optical label tracking can have number of useful applications in life sciences and condensed matter physics. Delivery of gold nanostructures to desirable cells using targeting moiety or carries (e.g., liposomes or polyelectrolyte hollow capsules) can be used to accumulate nanoparticles directly within live cells. It is reported that the closed packing of the nanoparticles resulted in non-linear or synergistically amplified photothermal effects, thus strongly enhancing their diagnostic and therapeutic ability [3,7]. Recently, the influence of nanoparticle aggregation on the efficiency of electromagnetic absorption has been studied in order to lower the threshold fluence level for biomedical applications such as laser-induced photothermal therapy [3]. From photothermal therapy perspective, a wavelength with maximal absorption and high absorption cross-section are the key features to consider [7-11]. However, when studying single nanoparticles, it is crucial to verify that one does not detect aggregation. Although the plasmonic metal nanoparticles exhibit large optical absorption cross sections, they have rarely been used as single molecule probe to track biological events in cells. Optical techniques can detect gold nanoparticles with sizes in the order of few tens of nanometers but it becomes more difficult as the nanoparticle becomes smaller since the scattered intensity decreases with power of six of particle diameter [12]. The size of nanostructures is one of the most key factors determining their unique optical properties [13]. Some current techniques used to quantitively determine the size of nanoparticles are dynamic light scattering, Transmission Electron Microscopy (TEM), Scanning Electron Microscopy (SEM) and Atomic Force Microscopy (AFM), etc. [14]. Jacobson [15] has shown that AuNPs can be readily distinguished from background scatterers by using interferometric method and the wavelength dependence of plasmon resonances. Kimura et al. [16] employed AFM to visualize subsurface AuNPs buried in a soft polymer matrix with a depth of 1 μm, and in a recent research, Chen et al. [17] used polarized light for imaging single gold nanorods with improved Signal-to-Noise Ratio (SNR).
The basic operating principle of near field microscopes, for example AFM, is to scan the surface with a sharp tip which effectively provides some information about height of the sample, therefore, makes the reconstruction of the object topography possible [18,19]. In order to apply AFM, an interaction occurs between the probe tip and the object, which in the case of biological samples should be kept minimum or preferably avoided to prevent possible surface alteration or even damage. Generally, AFM can produce sharp images with high resolution near the object surface but no chemical or functional information is provided, which can be counted as a disadvantage particularly when it cannot be used selectively. One way to overcome such limitation is to use it with other methods for example, optical fluorescence microscope [20].
AFM and optical microscopy make a powerful combination in the study of biological samples. AFM does not suffer from Abbe’s resolution limit, and can generate images with a much higher resolution than light microscopy. However, as contrast is generated in response to the structural properties of the sample, it can be a challenging issue to detect specific structure in a heterogeneous medium, such as a cell. Microscopy imaging methods are either dark field microscopy, which is based on the particle scattering [21] or a combination of dark field and the background scattering, thus resulting in an interference signal which can produce a better image of smaller nanoparticles than the dark microscopy alone [22]. An interferometric technique which relies on the interference effect has been applied to localize individual particles on 2D matrix and to measure average particle diameters [15]. The interferometry allows sensitive measurements of changes in the field amplitude, which in turn can reveal the presence of nanoparticles via their absorptive or scattering properties. The inherent phase shift due to the plasmon resonance can be applied to detect nanoparticles. In addition, the phase shift can be further enhanced by using a localized heating to intentionally varying the local phase as in the case of photothermal method. However, by combining the two techniques, it is expected a higher resolution structural information to be generated [20,23]. In this perspective, we describe the combined dual mode of AFM and iSCAT microscopy for measuring the size of individual PVP-stabilized gold Nanoshells by detection of a single particle scattered field.
Theory
The reference wave for interferometric detection can be created very simply by reflection of the light beam from the surface of the sample's glass substrate, as originally was proposed by Plakhotnik and Palm [24] applied to metal nanoparticles [15,25] and single particle tracking [26]. The light beam is focused through a microscope objective onto a glass substrate on which the gold nanostructures are adsorbed and covered by either immersion oil [25] or water [15]. The scattering efficiency depends strongly on the incident light-nanoparticles interaction. The refractiveindex mismatch between the surrounding medium and the glass substrate causes a small part of the incident beam to be reflected. This reflected field acts as the reference field (Eref) and interferes with the field scattered from the surface of nanoparticle (Escatt) which is small compared to the wavelength of light, hence leading to an intensity at the detector Idet [15].
 (1)
(1)
Here, r is the reflection amplitude of the field, s=|s| exp (iφ) is the scattered field amplitude supposed to be in the same spatial mode as the reference field (e.g., a spherical wave or a Gaussian wave), φ is the scattering phase, and Ei is the amplitude of the incident field, and |Ei|2 r2 is the reflection intensity. The sine function arises from the Gouy phase shift, -π/2, of the focused reflection. The first of the three terms in Equation 1 corresponds to the background scattering intensity, and the second term is the scattering contribution due to nanoparticle, which scales as D6 and is dominant for large particles. The third term is the interference term, which scales as D3 and is more important than scattering for smaller sizes. The constants A, B depend on the experimental parameters and the physical properties of materials. Since the pure scattering and the interference terms have opposite signs, the size dependence of the signal has a complex shape. It is negative for small particles (the cross term dominates) and becomes positive for larger nanoparticles (the direct scattering term dominates, as in dark-field detection [27] or total internal reflection [28]. The cross-over point depends on the strength of the reference wave, i.e., on the index of refraction of the medium. The high sensitivity of iSCAT means, however, that any slight variation in the index of refraction or topography can lead to a sizable contrast. Hence, it is important to account for fluctuations of the index of refraction, length or absorption in the sample.
Materials and Methods
Chemicals
The following reagents were purchased from Merck: Ferric chloride hexahydrate (FeCl3.6H2O, 99%), ferrous chloride tetrahydrate (FeCl2.4H2O, 99%), hydrochloric acid (HCl, 37%), sodium hydroxide, chloroform, formaldehyde solution (H2CO, 37%), and polyvidone25. Tetrakis (hydroxymethyl) phosphonium chloride (THPC) was purchased from Aldrich. Gold (chloride trihydrate (HAuCl4.3H2O, ≥ 49% Au basis), 3-aminopropyltriethoxysilane (APTES) are purchased from Sigma. Deionized water (18 MΩ) was provided by a Milli-Q system and deoxygenated by vacuum for 1 hour prior to its use.
Synthesis of MPNSs
The stock solutions of 1.28 M of FeCl3.6H2O), 0.64 M of FeCl2.4H2O) and 0.4 M of HCl were dissolved in deionized water to produce the iron source. An amount of 25 ml of iron source was then added into 250 ml of alkali source of 1.5 M of NaOH and stirred vigorously at 1500 rpm for 30 min at room temperature under N2 gas [29-31]. Fe3O4 was expected to be completed at a pH value of between 7.5-14 and a molar ratio of Fe2+: Fe3+=1:2. The nanoparticles were suitably modified by amine groups in order to prevent from their agglomeration and possible oxidation. 0.074 g of Fe3O4 NPs were dispersed in 25 ml of ethanol using sonication. This was followed by diluting the solution by 150 ml by 1 ml of deionized water and ethanol. To add amine group, 35 μl of APTS was added to the solution and then stirred vigorously for 7 hours at room temperature. The APTS-functionalized MNPs were washed 5 times and then freeze-dried. The AuNSs precursor were prepared by adding 1 ml of APTS-functionalized MNPs into 40 ml of THPC gold solution and 4 ml of 1 M NaCl and left for 12 hours at 4°C. AuNSs were fabricated by adding 1 ml of precursor suspension to 9 ml of plating solution. 50 μl of H2CO was added into a 10 ml prepared suspension of precursor NPs in plating solution and aged for 15 min as suggested by our group [32,33]. The Fe3O4/Au nanoshells were finally washed and collected by centrifuge.
Method
Samples of colloidal suspensions of MPNSs are prepared by dilution in Milli-Q water. Approximately 10 μL of the suspension was deposited on the surface of cleaned glass and spin-coated at 1500 rpm for 30’s, followed by drying at 3000 rpm for 30’s. Glass cover slides were cleaned by sonication for 20 min using Hellmanex (Hellma) solution in water (2%), isopropanol (both 96% purity) and ethanol (both 96% purity).
Imaging
Since, the scattered signal is assumed to be coherent i.e., photons preserving their phase, the interferometric scattering (iSCAT) is expected to detect weak signals scattered from small nanoparticles using a homodyne measurement relying on the interference between a weak signal and a strong local oscillator. The high signal to noise ratio (SNR) of iSCAT provides a high localization accuracy of the point-spread function and thus, a high temporal resolution. Basically, an iSCAT microscope is an inverted optical microscope which uses a 532 nm green continuous-wave laser wavelength (Verdi G2, Coherent, Santa Clara, CA) as an incident light. The laser light was focused at the back focal plane of an oil-immersion objective (UPLSAPO 100XO, NA1.4, Olympus, Tokyo, Japan), hence providing a wide-field illumination on the object in an area of ~5 μm in diameter. In order to increase the area of flat illumination, the laser light was scanned by few mrad in both lateral directions using two-axis acousto-optic deflectors (DTSXY-400, AA Opto-Electronic, Orsay, France). The corresponding scattered and reflected components were then collected by an objective lens, reflected by a beam splitter which then triggered by the CMOS camera (MVD1024W- CL, Photon focus AG). Scanning the beam provides a homogeneous irradiation area of 10 μm2 × 10 μm2. The excitation intensity at the sample was about 8 kW/cm2. We examined the optical interference between the scattering radiation from the NPs and the light directly emitted from the AFM tip. The iSCATAFM- nanosource can be moved to any point on the nanoparticle surface that is accessible by AFM. The combined technique used here is an integration of commercially available AFM (Nanowizard II, JPK Instruments) with an iSCAT set-up, which was placed on an active vibration isolation optical table (Thorlabs). AFM imaging was performed in tapping mode with Top Visual cantilevers (force constant ~50 Nm-1, NT-MDT) under dry conditions. The objective was slightly retracted during AFM scanning to reduce coupled vibrations.
Statistical Analysis
All the experiments were performed at least three times and the value of particle size determined by TEM, AFM, and iSCAT micrographs is the average of at least 50 measurements which is reported as mean ± standard deviation. The calculations are done using SPSS 15.0.
Results and Discussion
UV-Vis Spectroscopy
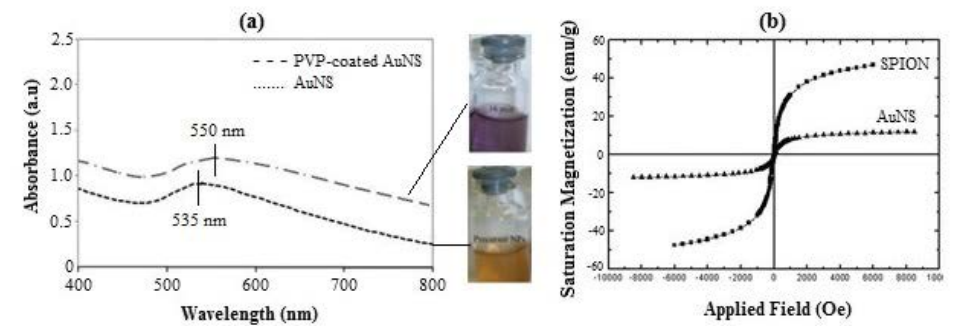
In order to observe optical changes, UV-Vis absorption spectroscopy of synthesized NPs was performed. SPR wavelengths of 535 nm and 550 nm were obtained for uncoated and PVP-coated AuNSs respectively with a total size of 15.8 nm ± 3.5 nm (Figure 1). A red shift of 15 nm is mainly due to increase in shell thickness and agglomeration of NPs which is expected to cause a corresponding increase in the extinction coefficient. Formation of aggregated nanoparticles results in change of solution colour and it gradually appears darker (Figure 1a). The larger FWHM of the curve can be attributed to the polydispersity of particle size as well as reduced mean free path of conduction electrons. The curve tail progressively increased beyond λSPR. The nanoshells produced by Lim et al. [31] had an 18 nm magnetic core and a gold shell thickness of 5 nm with a surface plasmon peak position, λSPR at 605 nm. Pham et al. [32] reported a SPR wavelength of 528 nm for Au/Fe oxide Nano shells with a size range of 15 nm to 40 nm. Figure 1b confirms the superparamagnetic nature of magnetization curves for SPION and AuNS at ambient temperature due to absence of hysteresis loss with zero coercivity. The saturation magnetization (Ms) of about 46.94emu/g of SPIONs was reduced to about 11.98 emu/g after gold coating. These results are higher than those obtained by Xu et al. [33] for the similar magnetite core size and gold shell thickness of 3 nm (Figure 1).
The plasmon resonance wavelength is one of the critical optical properties of core-shell nanoparticles which determines the applications of any fabricated Nano shells. The SPR properties of noble nanoparticles have been studied and compared to Mie theory [12,34]. The large nanoparticles with diameters, D ≥ 20 nm, exhibited a red shift in the resonant peak energy as the size increases. When the size increases further, D ≥ 20 nm, the SPR line width widens due to radiative damping of the collective electronic excitation. However, in the case of smaller nanoparticles, D<20 nm, such extrinsic size-effects become negligible and intrinsic size effects dominate. The λSPR can be estimated using Drude model, as follow [35]
 (2)
(2)
where, ε∞ is the high-frequency dielectric constant due to the interband transitions, εm(=n2) is the dielectric constant of the medium, and λp is the bulk metal plasmon wavelength, is given by
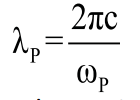 (3)
(3)
where c is the speed of light in a vacuum and ωp is the metal’s bulk plasma frequency which is defined by density of the conduction electrons N, electron charge e (1.6 × 10⁻¹⁹ C), permittivity of free space ε0, and effective free-electron mass m0 as:
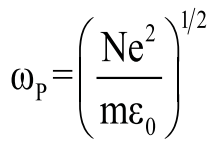 (4)
(4)
The plasmon linewidth is dominated by electron surface scattering. According to Mie's theory [36], the broadening of resonance absorption is related to the size, shape, and aggregation of the nanometer scale metallic particles. It is known that coupling of the LSPR of nanoshells can result in red-shift of λSPR and also broadens the SPR band. The change of the size of nanoparticles in comparison to the wavelength of light can produce different order of polarization ranging from the lowest dipolar to higher order multipoles. In the case of particles much smaller than the wavelength of light, the electron oscillation can be considered to be predominantly dipolar in nature. In the dipolar mode, the polarizability of a sphere of volume V is given by the Clasius-Mossotti relation [37]
 (5)
(5)
The complex dielectric permittivity of AuNP which gives the SPR band is defined by
ÃÆââ¬Â ÃâÃÂg= ÃÆââ¬Â ÃâÃÂr + iÃÆââ¬Â ÃâÃÂi (6)
where εr=(ng2-ke2) is the real part which determines the degree to which the metal polarizes in response to an applied external electric field i.e., it determines the SPR spectral peak position, ng is the refractive index of gold and ke(ω)=λ α/4π, is the extinction coefficient, where ω is the angular frequency of the light, and α is the absorption coefficient. Also, the imaginary part, iεi=2 ngke yields the relative phase shift of the induced polarization with respect to the external field, i.e., it determines the bandwidth and includes losses such as ohmic heat loss. Maximum extinction coefficient occurs when εg+2εm=0. Note that the complex refractive index ![]() is related to εg as εg=ñ2=(nr+ike2) where nr=kλ/2π is the real part of the refractive index indicating the phase velocity. The above argument has been successfully used by Khosroshahi et al. [6] to show the role of AuNPs in producing contrast-enhanced imaging of biological fluids such as blood using photoacoustic imaging technique where the imaginary part as non-radiative component can affect the quality of imaging.
is related to εg as εg=ñ2=(nr+ike2) where nr=kλ/2π is the real part of the refractive index indicating the phase velocity. The above argument has been successfully used by Khosroshahi et al. [6] to show the role of AuNPs in producing contrast-enhanced imaging of biological fluids such as blood using photoacoustic imaging technique where the imaginary part as non-radiative component can affect the quality of imaging.
Equation 5 incorporates the dependence of polarizability on the dielectric function of the metal and polarizability has a strong maximum when εg=-2εm. Therefore, a change in εm will result in corresponding change of plasmon resonance wavelength observed as a red shift as seen in Figure 1. Furthermore, an increase in the medium dielectric constant results in the weakening of the Coulombic restoring force on the displaced electron cloud and hence lowering the plasmon oscillation frequency. Thus, any changes in the refractive index of the surrounding medium around the nanoparticle caused by for example adsorption of molecules or change of the solvent will affect the SPR position. Additionally, plasmon shifts due to adsorbate-metal interactions caused by the perturbation of the conduction electron density of NPs have been reported [38]. Chemical interaction of the electrons with adsorbates can also results in a broadening of the plasmon resonance band, which is known as chemical interface damping [39].
TEM
The TEM image of MPNSs particles is shown in Figures 2a-2f where growing of the gold shell increased the particle size of SPION from 9.5 nm ± 1.4 nm to an average size of 15.8 nm ± 3.5 nm, (Figure 2b) for size distribution.
Combined AFM-iSCAT imaging system
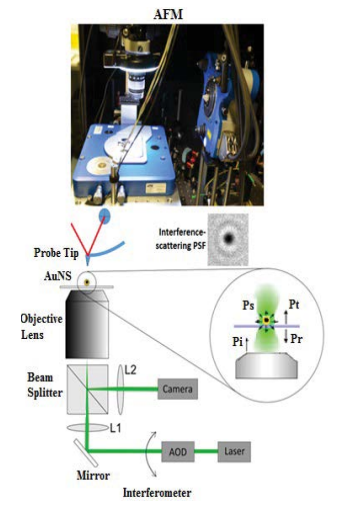
A schematic of the combined iSCAT-AFM imaging system is illustrated in Figure 3 where the combined technique is used to measure the size of individual MPNS and possibly give an image of their size distribution. Since, the size of a NPs are not calibrated directly at the single particle scale, but it is done by correlating the distributions obtained from the interferometric signals with sizes achieved by AFM distributions. The technique employed in our case was validated and confirmed by reconstructing the size distributions measured by TEM using the single NP quantification result. This method as explained by Jacobsen [40] is based on interferometric detection of backscattered light and can therefore can be used for all light scattering NSs. Prior to AFM experiments, the MPNSs were immobilized on a glass slide via spin coating and the optical images of MPNSs with an average diameter of 15.8 nm ± 3.5 nm were recorded. As shown in Figure 3, the single MPNSs are clearly seen as dark spots, which is due to the destructive interference between the scattered and the reflected light from the glass-air interface [15]. A corresponding intensity distribution interference was obtained by analyzing a number of single MPNSs. Three MPNSs were measured by TEM and the mean value of their size was recorded. An important advantage which can be considered for such a technique as correlative microscopy is its application as a validation tool of other developed microscopy techniques. The image alignment is achieved by scanning the AFM cantilever (i.e., the probe tip) on a defined area e.g., 30 mm2 × 30 mm2 during which the optically mapping of the actual position of the cantilever is performed. The next step is to consider is the type of substrate which should be used to prepare the sample. Clearly, a substrate with suitable optical properties is preferable so that an efficient single MPNS detection, accurate localization, and smoothness for optimized AFM imaging can be made. In this case, a smooth and clean slide glass was used for the imaging experiment. The AFM tip was aligned on top of the iSCAT microscope by finding the scattering signal of the cantilever tip close to the surface of the sample substrate (Figure 3). To achieve a finer alignment of the tip over a desired position, an optical calibration was carried out prior to the test in order to reduce or eliminate the possible optical aberrations introduced by optical elements such as scan lens and tube lens present in the microscope beam scanning path. The AFM software was used to process and generate the optical image of AFM scans at any position, and the scan direction of the tip in ta given scan field. Although, both of these techniques can operate independently and simultaneously, the oil immersion objective lens of the optical microscope was retracted from the sample surface during the fine AFM scanning due to the sensitivity of AFM to environmental condition such as noise or pollution (Figure 3).
Figure 3: Schematic of the experimental set-up for AFMiSCAT.The AFM scan head can be easily applied to the microscope. Principle of iSCAT in reflection configuration. A nanoparticle of diameter D is illuminated by a light beam with power Pinc. Part of the light (Pref) will serve as a reference beam and part of the light is scattered by the particle (Pscat).In the imaging plane, the two beams can interfere leading to an enhancement of the scattering signal.
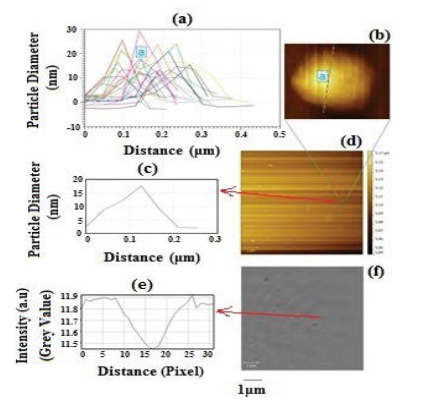
AFM images are recorded in air to characterize the topography of the samples. The results of AFM studies are shown in Figure 4 where (a-d) represents AFM image and size distribution of the MPNSs and (e-f) the iSCAT image of the same area. Clusters of few particles were formed during drying process mainly due to the capillary forces even when the samples were highly diluted. As discussed above in order to have sufficient contrast, the difference in refraction index of nanoparticles and the surrounding liquid need to be as high as possible. Also, it is noteworthy that the overall detection efficiency of the setup depends on the dimension of nanoparticles controlling the degree of scattering and the type of material, which governs the absorption component. The AFM-iSCAT cross-correlation analysis (Figure 4) reveals a nanoscale alignment between the two images, which is repeatable. The average size of nanoparticle is 16.5 nm ± 3.8 nm (Figure 4a) which corresponds to a contrast of 7% ± 2.3% (Figures 4e and 4f).
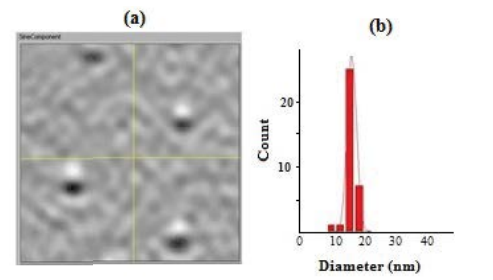
In iSCAT, the sample is illuminated with a 532 nm laser wavelength, which then a portion of the scattered light is collected. The scattered light interferes partly with the incident light that is partially reflected at the glass/air interface, leading to a contrast, which is proportional to the polarizability of the nanoparticles. Furthermore, analysis of the iSCAT image point-spread function allows one to localize the nanoparticle with nanometer precision. As the refractive index of gold nanoshells differs from that of the surrounding air, they appear dark on top of a constant background rather than a bright spot. Figures 5a and 5b clearly demonstrates MPNSs with dimension of 15.8 nm ± 3.5 nm.
The size distribution of the MPNSs with a nominal diameter of 15 nm agreed well with the size distribution recorded by TEM shown in Figure 2 (~10%), demonstrating the feasibility of the technique. The minimum size that can be detected will inevitably depend on a number of parameters such as particle volume, polarizability of the material, dielectric constant of the liquid, and the specification of the setup (laser power, objective lens, etc.).
Conclusion
In this work, Au coated Fe3O4 nanoshells were synthesized. We combined AFM with optical microscopy to study the light scattering properties of MPNSs. It is shown that a dual mode measuring system based on the interferometric optical method (i.e., iSCAT) using an interference signal and the AFM size distribution can be used to determine the size of single nanoshell. The reliability and the precision of the measurements can be examined at nanoscale where some useful biomedical applications such as drug delivery can be considered. AFM-iSCAT is relatively a simple technique, which can be used for different kinds of nanoparticles provided a correct laser wavelength is utilized to optimize the surface plasmon resonance condition. It is also possible to use AFM-based interferometric measurements in future work to monitor surface plasmon polaritons coherence losses and phase shifts in complicated biological systems.
Acknowledgements
Professor MEK and Dr LG sincerely acknowledge Professor Vahid Sandoghdar from the Max Planck Institute for the Science of Light (MPL) for providing the doctoral student award to LG in his group as a joint collaboration. We also would like to thank Dr. Jens Ehrig and Dr. Marek Piliarik at the MPL for assistance with AFM-iSCAT measurements and helpful discussions.
References
- Boisselier E, Astrue D (2009) Gold nanoparticles in nanomedicine: preparation, imaging, diagnostic, therapies and toxicity. Chem Soc Rev 38: 1759-1782.
- Lin AW, Lewinski NA, West JL, Halas NJ, Drezek RA (2005) Optically tunable nanoparticle contrast agents for early cancer detection: Model-based analysis of gold nanoshells. J Biomed Opt 10: 064035.
- Khlebtsov B, Zharov V, Melikov A, Tuchin V (2006) Optical amplification of photothermal therapy with gold nanoparticles and nanoshells. Nanotechology 17: 5167-5179
- Huang X, Jain PK, El-Sayed IH, El-Sayed MA (2007) Gold nanoparticles: Interesting optical properties and recent applications in cancer diagnostics and therapy. Nanomed 2: 681-693.
- Wang B, Joshi P, Sapozhnikova V, Amirian J (2010) Intravascular photoacoustic imaging of macrophages using molecularly targeted gold nanoparticles. SPIE 7564: 75640A.
- Khosroshahi ME, Mandelis A, Lashkari B (2015) Frequency-domain photothermoacoustic and ultrasonic imaging of blood and opto-thermal effects of plasmonic nanoparticle concentrations. J Biomed Opt 20: 076009.
- Pustovalov V, Astafyeva L, Galanzha E, Zharov V (2010) Thermo-optical analysis and selection of the properties of absorbing nanoparticles for laser applications in cancer nanotechnology. Cancer Nanotechnol 1: 35-46.
- Hassannejad Z, Khosroshahi ME, Firouzi M (2014) Fabrication and characterization of magnetoplasmonic liposome carriers. Nanosci Technol Symbiosis 1: 1-9.
- Khosroshahi ME, Ghazanfari L, Hassannejad Z, Lenher S (2015) In-vitro Application of Doxorubicin loaded magnetoplasmonic thermosensitive liposomes for laser hyperthermia and chemotherapy of breast cancer. Int J Nanomed Nanotech 6: 1-11.
- Khosroshahi ME, Hassannejad Z, Firouzi M, Arshi A (2015) Nanoshell-mediated targeted photothermal therapy of HER2 human breast cancer cells using pulsed and continuous wave lasers: an in-vitro study. Lasers Med Sci 30: 1913-1922.
- Khosroshahi ME, Ghazanfari L, Khoshkenar P (2014) Experimental validation and simulation of fourier and non-fourier heat transfer equation during laser nano-phototherapy of lung cancer cells: An in vitro assay. J Modern Phys 5: 21-25.
- Boheren C, Huffman D (1983) Absorption and scattering of light by small particles. Wiley Interscience, NewYork, USA.
- Wang W, Nongjian T (2014) Detection, counting, and imaging of single nanoparticles. Analyt Chem 86: 2-14.
- Wang ZL (2000) Characterization of nanophase materials. Wiley-VCH, Weinheim, Germany.
- Jacobsen V, Stoller P, Brunner C, Vogel V (2006) Interferometric optical detection and tracking of very small gold nanoparticles at a water-glass interface. Opt Express 14: 405-414.
- Kimura K, Kobyashi K, Matsushige K, Yamda H (2013) Imaging Au nanoparitcles deeply buried in polymer matrix by various atomic force microscopy techniques. Ultramicroscopy 133: 41-40.
- Chen Y, Chen X, Cao Q, Xu K (2015) Selectively imaging single gold nanorods by polarized light microscopy with low background. Plasmonics 10: 1883-1888.
- Binnig G, Quate C, Gerber C (1986) Atomic force microscope. Phys Rev Lett 56: 930-933.
- Stark M, Möller C, Müller D, Guckenberger R (2001) From images to interactions: High-resolution phase imaging in tapping-mode atomic force microscopy. Biophys J 80: 3009-3018.
- Kassies R, Lenferink A, Hunter A, Olsen J (2005) Combined AFM and confocal fluorescence microscope for applications in bio-nanotechnology. J Microsc 217: 109-116.
- Seekell K, Crow M, Marinakos S, Ostrander J (2011) Hyperspectral molecular Imaging of multiple receptors using immunolabeled plasmonic nanoparticles. J Biomed Opt 16: 116003.
- Lindfors K, Stoller PV, Sandoghdar V (2004) Detection and spectroscopy of gold nanoparticles using supercontinuum white light confocal microscopy. Phys Rev Lett 93: 037401.
- Miklós S, Kellermayer Z (2004) Combined atomic force microscopy and fluorescence microscopy. Methods Mol Bio 736: 439-456.
- Plakhotnik T, Palm V (2001) Interferometric signatures of single molecules. Phys Rev Lett 87: 183602-183605.
- Schultz S, Smith D, Mock J, Schultz D (2000) Single-target molecule detection with nonbleaching multicolor optical immunolabels. Proc Natl Acad Sci 97: 996-1001.
- Khosroshahi ME, Ghazanfari L (2011) Amino surface modification of (Fe3O4/SiO2) nanoparticles for bioengineering applications. Surf Eng 27: 573-580.
- Khosroshahi ME, Ghazanfari L, Tahriri M (2011) Characterization of binary (Fe3O4/SiO2) biocompatible nanocomposites as magnetic fluid. J Exp Nanosci 6: 580-595.
- Khosroshahi ME, Ghazanfari L (2012) Synthesis and functionalization of SiO2 coated Fe3O4 nanoparticles with amino groups. Mat Sci Eng C 32: 1043-1049.
- Khosroshahi ME, Ghazanfari L (2012) Physicochemical characterization of Fe3O4/SiO2/Au multilayer nanostructure. Mater Chem Phys 133: 55-62.
- Ghazanfari L, Khosroshahi ME (2014) Simulation and experimental results of optical and thermal modeling of gold nanoshells. Mat Sci Eng C 42: 185-191.
- Lim J, Lanni F, Tilton R, Majetich S (2008) Synthesis and single-particle optical detection of low-polydispersity plasmonic-superparamagnetic nanoparticles. J Adv Mater 20: 1721-1726.
- Pham T, Sim S (2008) Application of citrate-stabilized gold coated ferric oxide composite nanoparticles for biological separations. J Magn Mater 320: 2049-2055.
- Xu S, Hou Y, Sun S (2007) Magnetic core/shell Fe3O4/Au and Fe3O4/Au/Ag nanoparticles with tunable plasmonic properties. J Am Chem Soc 129: 8698-8699.
- Mie G (1908) Beitra¨ge zur Optik tru¨ber Medien speziell kolloidaler Goldlosungen (contributions to the optics of diffuse media, especially colloid metal solutions). Ann Phys 25: 377-445.
- Mulvaney P (1996) Surface plasmon spectroscopy of nanosized metal particles. Langmuir 12: 788-800.
- Kelly LK, Coronado E, Zhao L, Schatz G (2002) The optical properties of metal nanoparticles: The influence of size, shape, and dielectric environment. J Phys Chem B 107: 668-677.
- Mulvaney P, Giersig M, Liz-Marzán L, Pecharromán C (2006) Drastic surface plasmon mode shifts in gold nanorods due to electron charging. Plasmonics 1: 61-66.
- Ewers H, Klotzsch E, Smith A, Helenius A (2007) Label-free optical detection and tracking of single virions bound to their receptor in supported membrane bilayers. Nano Lett 7: 2263-2266.
- Piliarik M, Sandoghdar V (2014) Direct optical sensing of single unlabeled proteins and super-resolution imaging of their binding sites. Nat Commun 5: 4495.
- Jacobsen V, Klotzen E, Sandoghdar V (2007) Interferometric detection and tracking of nanoparticles. Nano Biophotonics 3: 143-159.
Open Access Journals
- Aquaculture & Veterinary Science
- Chemistry & Chemical Sciences
- Clinical Sciences
- Engineering
- General Science
- Genetics & Molecular Biology
- Health Care & Nursing
- Immunology & Microbiology
- Materials Science
- Mathematics & Physics
- Medical Sciences
- Neurology & Psychiatry
- Oncology & Cancer Science
- Pharmaceutical Sciences
