Effect of Cd and N doping on Zinc Sulphide Nanoparticles Synthesised by Mechanochemical Method for the Photodegradation of Brilliant Green Dye
Madhuri MB and Lokhande PB
Madhuri MB* and Lokhande PB
Department of Chemistry, Dr. Babasaheb Ambedkar Technological University, Maharashtra, India
- *Corresponding Author:
- Madhuri MB
Department of Chemistry
Dr. Babasaheb Ambedkar Technological University
Vidya Vihar, Mumbai Goa Highway, Lonere-Raigad, Maharashtra, India
Tel: 9975636701
E-mail: madhurisd16@gmail.com
Received Date: April 01, 2019; Accepted Date: May 21, 2019; Published Date: May 28, 2019
Citation: Madhuri MB, Lokhande PB (2019) Effect of Cd and N doping on Zinc Sulphide Nanoparticles Synthesised by Mechanochemical Method for the Photodegradation of Brilliant Green Dye. Nano Res Appl Vol.5 No.1:1. DOI: 10.36648/2471-9838.5.1.38
Abstract
In present study, the removal of carcinogenic Brilliant Green dye was achieved by novel Mechanochemically synthesized Cd and N doped Zinc Sulphide nanoparticles. The morphological characteristic of spherical Zinc Sulphide nanoparticles was determined by SEM. The elemental analysis of Zinc Sulphide was examined by EDX. X-Ray diffraction study revealed the hexagonal wurtzite structure of Zinc Sulphide nanoparticles. The decrease in the crystallite size of Zinc Sulphide was observed from 67 nm to 59 nm on doping with Cd and N. The UV-Visible absorption Spectroscopy has shown narrowing of the band gap from the 3.0 eV to 2.5 eV. Photoluminescence (Pl) spectra of Zinc Sulphide nanoparticles has an emission in blue region at 340 nm due to the recombination of the electron and hole. The Cd and N doped Zinc Sulphide has more degradation efficiency in sunlight as compared to UV light. 50 mg of Cd and Zn doped Zinc Sulphide per 100 ml of 25 ppm of B.G. dye and alkaline pH gave highest degradation of Brilliant green dye within 45 minutes.
Keywords
Photo catalyst; Nanoparticles; Brilliant green dye; Mechano-chemical method
Introduction
The discharged water from the textile and dye industry to the environment without any treatments can remain in the environment for a long period of time due to their high stability to light and temperature [1]. The Brilliant Green is one of such dye, which is used extensively in the textile industry for dyeing nylon, wool, cotton, and silk, as well as for coloring of oil, fats, waxes, varnish, and plastics. The paper, leather, cosmetic, and food industries consume a high quantity of triphenylmethane dyes of various kinds [2,3]. Brilliant Green was found to be carcinogenic to the human health [1].
In the past two decades, a class of newly developed inorganic - organic hybrid porous materials, namely metal – organic frameworks (MOFs) has generated rapid development due to their versatile applications such as in catalysis and separation. Recent research has showed that, these materials acting as catalysts are quite effective in the photocatalytic degradation of Organic pollutants. In recent years, interest in photocatalysis has focused on the use of semiconductor materials as photocatalyst for the removal of ambient concentrations of organic and inorganic species from aqueous or gas phase systems in environmental clean-up, drinking water treatment, industrial and health applications [4-6]. The Photodegradation property of the semiconductors is due to the special characteristic presence of band gap. The semiconductors form electron (e-) and hole (h +) pair when energy greater than band energy provided to the semiconductors. These electron and hole produces OH radicals through redox reaction. The OH radicals responsible for the oxidative degradation of organic dyes from the water [7,8].
Oxides and sulphides of metals are substantially used as the photocatalytic semiconductors. Zinc Sulphide is one of widely used semiconductors. It exits in cubic zinc blende and hexagonal wurtzite form. It has a band gap of 3.5 eV in cubic form and 3.7 eV in wurtzite form.
Successful decrease in band gap of Zinc Sulphide is achieved by the earlier researcher with 50-80% degradation efficiency. The co-doping with metal and nonmetal, in semiconductor photocatalyst shows the better degradation efficiency more than 80% [9-11].
In spite of this, a very few research have been reported on the non-metal doping. In present study, an attempt was made to incorporate Cd and N in to the Zinc Sulphide crystal. The Cd and N doped Zinc sulphide was synthesized by hand grind mechanochemical method by using morter and pestle. This is the effective method of synthesis of nanoparticles due to the solvent free synthesis and easiness in the handling of precipitate formed.
Materials and Methods
Synthesis of Cd and N doped Zinc Sulphide
Cadmium and Nitrogen doped Zinc sulphide was synthesized mechanochemically. For the preparation of Cd and N doped Zinc Sulphide (0.9) M, Zinc Acetate Dihydrate (0.01 M) and (0.1 M) Cadmium Acetate Dihydrate were taken in a morter and pestle, 1.3 M Oxalic Acid was added, and it was stirred mechanically for 10 minutes. Thiourea was added after 10 minutes as S and N source. The whole mixture was stirred for half an hour.
The product was collected after completion of reaction and the product was dried in oven on 110°C temperature followed by calcination at 350°C in furnace. Product was collected, characterised and used for the degradation experiments. For the synthesis of pure Zinc sulphide 1 M Zinc acetate dehydrate and 1 M Thiourea was ground along with Oxalic acid for about half an hour.
Results and Discussion
Characterization of Cd and N doped zinc sulphide nanoparticles
The zinc sulphide nanoparticles were characterized by Analytical techniques Scanning Electron Microscopy using JEOL model, Energy Dispersive X-Ray Spectroscopy X-Ray Diffraction study on PANalytical, the Netherlands, UV-Visible Spectroscopy on Perkin Elmer LAMBDA 950 and Photoluminescence Spectroscopy Jobin Yvon Fluorimeter.
Scanning electron microscopy
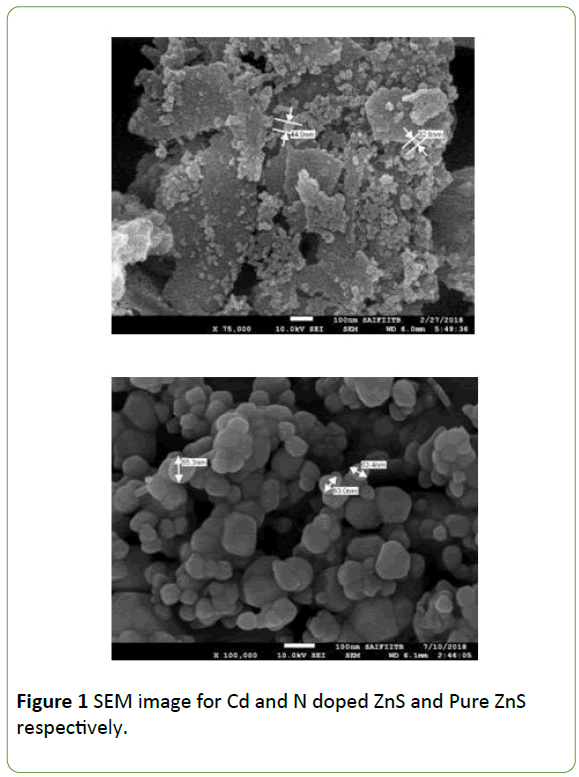
The shape distribution and nanoparticles size morphology of doped and pure ZnS was studied by Scanning Electron Microscopy. The Figure 1 is the SEM image for Cd and N doped zinc sulphide and pure zinc sulphide.
The 3D SEM image of Cd and N doped zinc sulphide and pure zinc sulphide shows that the nanoparticles produced are nano in size with the agglomeration of nanoparticles.
The size of the particles is in the range of 35-50 nm. The nanoparticles mostly appear as a cluster of spherical balls.
Energy dispersive X-Ray analysis
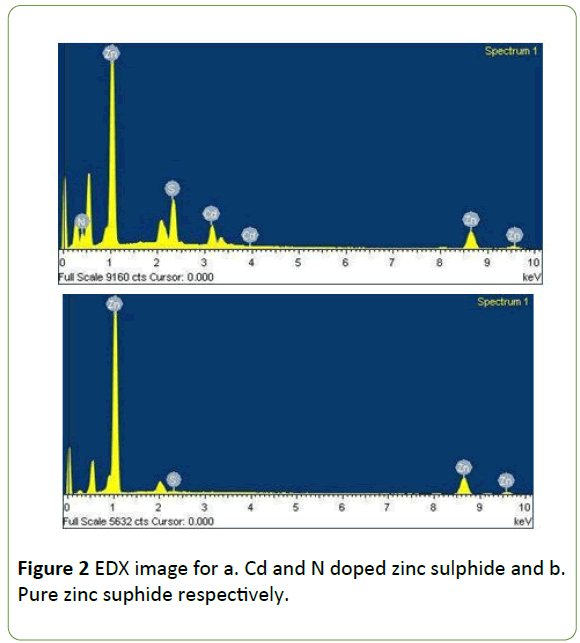
The elemental composition of doped and undoped zinc sulphide was studied by energy dispersive X-ray spectroscopy. The Figure 2 is the EDX image for Cd and N doped zinc sulphide and pure zinc sulphide. The Figure 2a shows the clear peaks for the Cd and N along with the Zn and S confirming the Zinc Sulphide crystal is incorporated with Cadmium and Nitrogen.
The Figure 2b is showing the two peaks for Zinc and Sulphur for the zinc Sulphide nanoparticles. The data reveals synthesised material is exactly Cd and N doped Zinc Sulphide nanoparticles and pure Zinc Sulphide nanoparticles respectively.
X-Ray diffraction spectroscopy
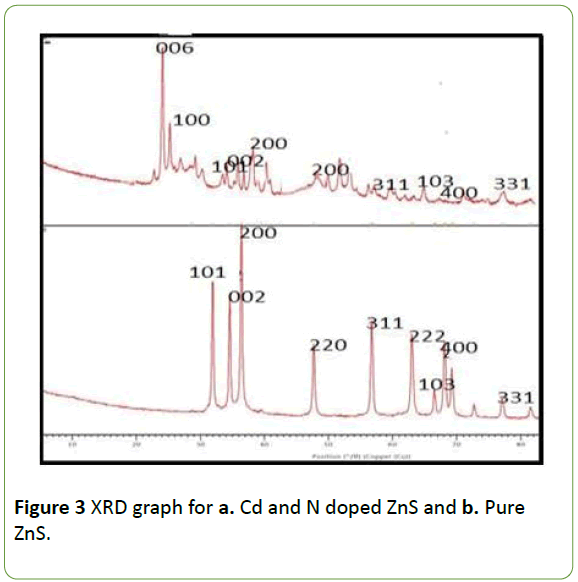
The study of zinc sulphide crystal properties has been done by X-Ray diffraction spectroscopy. The X-ray diffraction patterns of Cd and N doped ZnS and pure ZnS are as shown in Figure 3.
The XRD data depict that, the ZnS is having the wurtize structure as it shows similar plane in JCPDS card no. 39-1363 for hexagonal Cadmium Sulphide. The planes 101, 200, 002, 220, 311, 103,400 and 311 are representing the hexagonal wurtzite crystal for Zinc Sulphide.
An extra dominant peak is observed in case of doped Zinc sulphide of plane 006 is due to the presence of Nitrogen impurities. The decrease in the crystallite size on doping with Cd and N was calculated by Scherrer’s Equation by using XRD data Table 1 data reveals the decrease in the crystallite size of ZnS from 67.7 nm to 59.74 nm on doping with Cd and N.
| Compound | 2θ degrees | FWHM | Crystallite size nm |
|---|---|---|---|
| Cd and N doped ZnS | 24.108 | 0.2303 | 59.74 |
| ZnS | 36.387 | 0.2047 | 67.7 |
Table 1: Crystallite size for Cd and N doped ZnS and Pure ZnS.
The calculated crystallite size is tabulated in Table 1 as follows.
The lattice parameters for Cd and N doped ZnS were a = 3.0A0 and b = 4.8 A0. For pure Zinc Sulphide the lattice parameters calculated from the XRD data were a= 2.99 A0 and 4.9 A0, these values are nearer to the literature value for hexagonal planes.
UV-visible spectroscopy
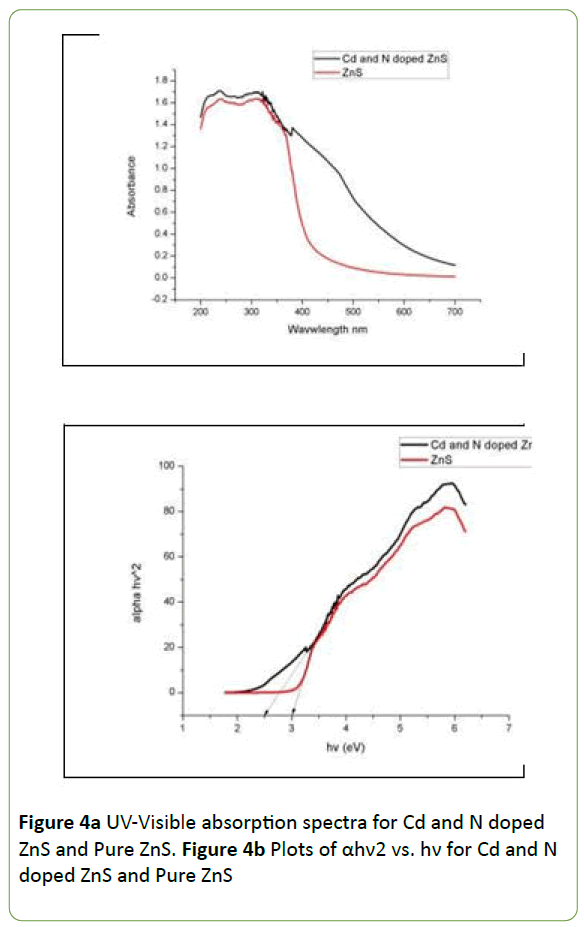
The optical properties of Cd and N doped Zinc Sulphide were studied by UV-Visible spectroscopy. The UV-Visible absorption spectra for doped and pure Zinc Sulphide is shown in Figure 4a and plot of (alpha hv2) versus hν was plotted in Figure 4b as follows.
The Figure 4a UV-Visible absorption spectra show the excitation absorption peak at 250 nm for both pure and doped Zinc Sulphide photocatalyst. Figure 4b illustrating that the band gap of pure zinc Sulphide from Tauc plot is confirmed at 3.0 eV and it is decreases to 2.5 eV by addition of Cd and N impurities.
Photoluminescence spectroscopy
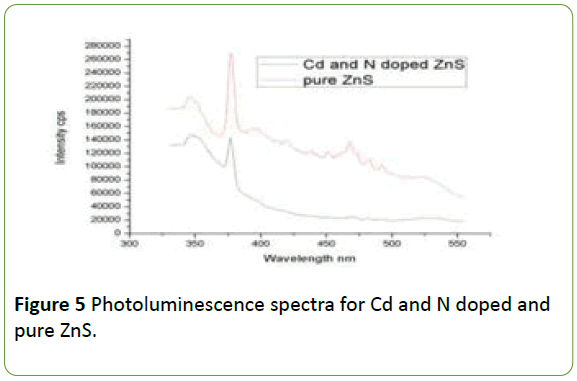
The Figure 5 is showing the normalized, room temperature photoluminescence spectra of Cd, N doped ZnS and pure ZnS respectively.
The Figure 5 illustrates that, the excitation peak for both doped and undoped ZnS is at 340 nm and intense emission peak at 355 nm. These peaks in blue region are due to the recombination of the electrons between the Sulphur-vacancyrelated donor and the valence band [12-15].
Many researchers have studied the blue emission from ZnS nanoparticles under UV excitation [16,17]. This emission is arise due to band to band transition. The decrease in the intensity of the Cd and N doped ZnS peak is due to the impurities of Cd and N which prevents the electron hole recombination.
Photodegradation study
Photodegradation efficiency of synthesized Cd and N doped Zinc Sulphide and pure Zinc Sulphide was achieved by the Photodegradation of Brilliant Green dye in Sunlight and in UV-light.
Photodegradation in sunlight
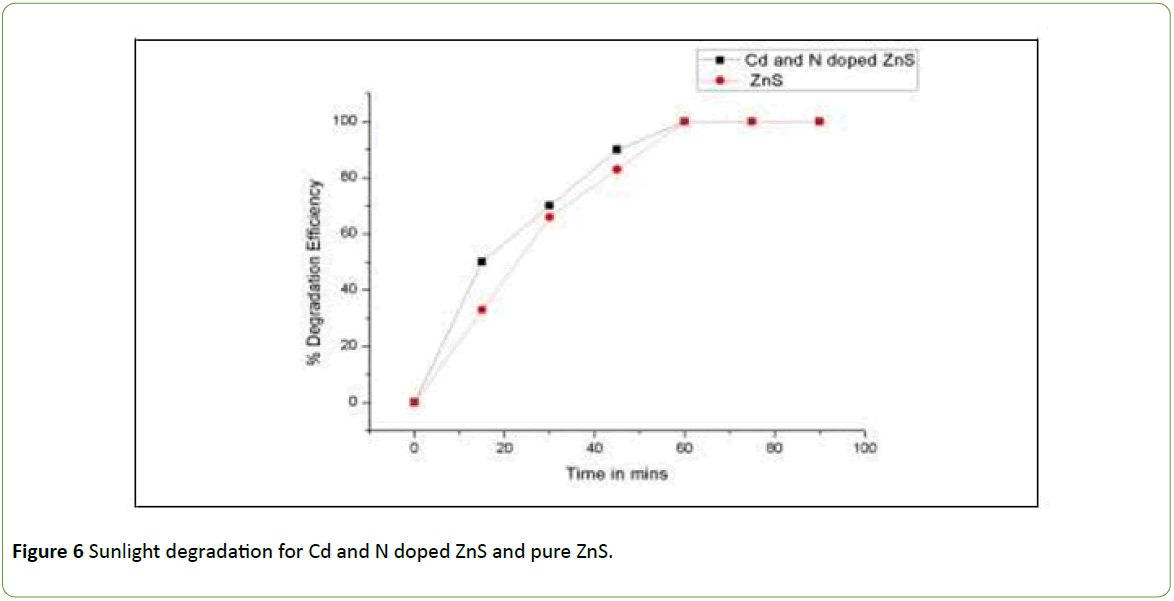
Brilliant Green dye was degraded under the sunlight with the use of mechanochemically prepared Cd and N doped Zinc Sulphide and pure Zinc sulphide nanoparticles. The degradation study was carried with 100 ml of 25 ppm Brilliant Green dye loaded with 75 mg of Cadmium Sulphide photocatalyst. The degradation reaction was carried out for 90 minutes. The degradation efficiency of photocatalyst was checked at 15 minute time interval by determining COD. The increase in degradation efficiency with time is plotted in the Figure 6.
The graph shows Cd and N doped ZnS have greater efficiency of BG degradation than pure zinc Sulphide in UV light. The decrease in the crystallite size on doping with Cd and N is main cause for the enhancement of photocatalytic degradation of Brilliant Green dye. The whole dye is completely removed in 60 minutes. The decrease in band gap (2.5 eV) is also favours the fast degradation rate.
Photocatalytic degradation in UV light
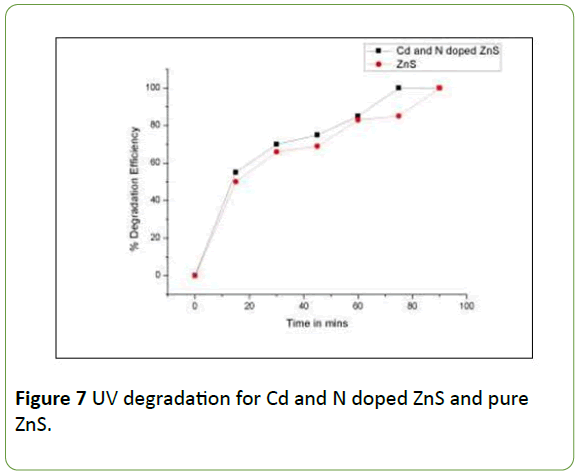
The UV degradation of Brilliant Green dye was checked by taking 100 ml of 25 ppm B.G dye with 25 mg of Zinc sulphide (Cd-N doped and undoped) photocatalyst in the reaction flask of the UV photoreactor. The degradation reaction was carried out for 90 minutes.
The samples were withdrawn after each 15 minutes time interval and COD was determined, % degradation efficiency was calculated and it was plotted against time as in Figure 7.
From the Figure 7, it can be clearly observed that the Cd –N doped ZnS greater efficiency than the pure ZnS nanoparticles due to small crystallite size fascinating the large surface area for photocatalytic degradation.
The UV degradation takes more time than the time required for degradation in solar light.
Effect of catalyst loading
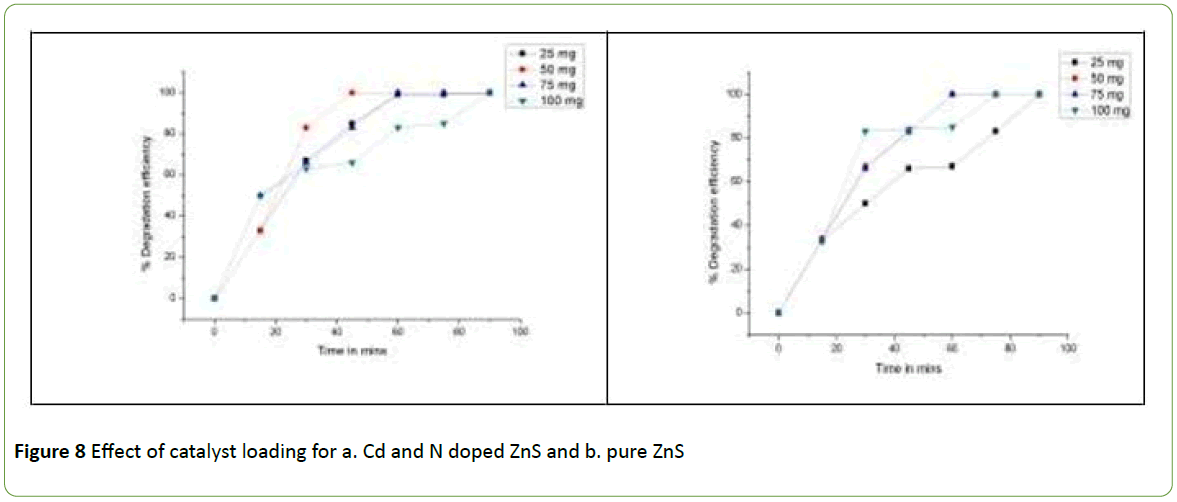
The catalyst concentration has a major role in photocatalytic reactions. For the study of effect of catalyst concentration the four catalyst concentration i.e., 25 mg/100 ml, 50 mg/100 ml, 75 mg /100 ml and 100 mg/100 ml, cadmium Sulphide photocatalyst/25 ppm Brilliant Green Dye concentration were taken in the consideration. The experiment was performed under sunlight for about 90 minutes. The COD was calculated at 15 minutes time interval and % degradation Efficiency was plotted versus time as in Figure 8.
The Figure 8 data reveals that 50 mg of Cd and N doped ZnS photocatalyst/100 ml of 25 ppm Brilliant Green dye solution has the highest tendency of the fast removal of Brilliant Green dye within 45 minutes.
Pure ZnS requires 60 minutes for the removal of B. G. with the same concentration. Overall one can clearly depict from the figure that 50 mg ZnS photocatalyst /100 ml of the Brilliant Green dye is the optimum concentration for the highest degradation.
Effect of pH
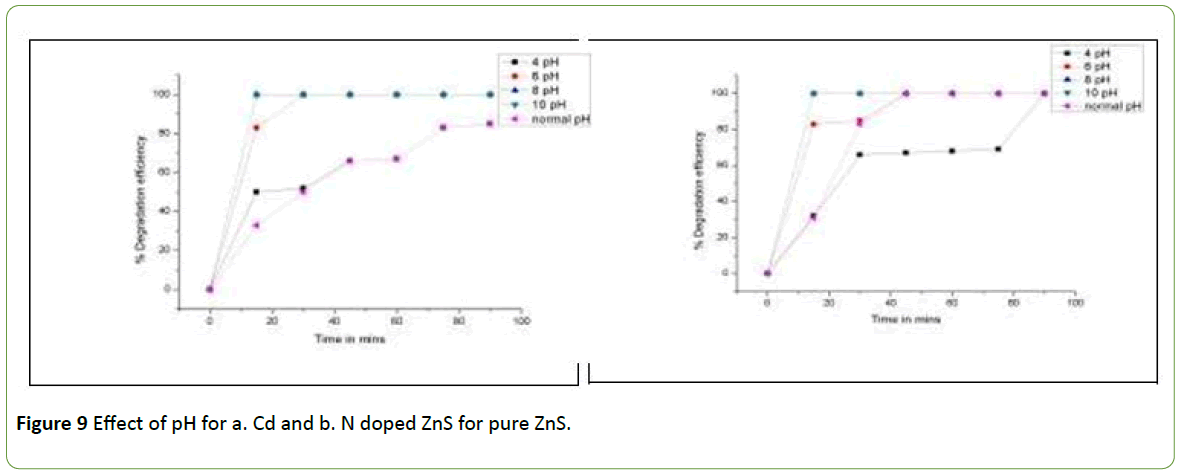
Since pH plays the important role in a photocatalysis, it is necessary to optimize the pH value for the most desirable photodegradation of pollutants. So the pH of ZnS photocatalyst and Brilliant Green dye suspension was noted to be 2.5 pH.
The pH 4. pH 6, pH 8 and pH 10 were studied along with normal pH. For the experimentation 50 mg /100 ml of 25 ppm Brilliant Green dye was filled in different five beakers. The pH of five beaker solutions were adjusted with the help of 0.1 N NaOH and 0.1 N HCl. These all five beakers were kept under sunlight with constant stirring for 90 minutes. The samples were collected after 15 minutes time interval and COD was determined. The % degradation efficiency was calculated and plotted against time as in Figures 9a and 9b.
The Figures 9a and 9b for both Cd and N doped ZnS and pure ZnS, are indicating that the degradation efficiency increases as the pH increase from 4 to 10 pH. This is due to the adjusted pH by NaOH. The production of OH radicals from OH- ions provided by NaOH fascinates the fast Photodegradation reaction. Hence one can conclude that basic pH has highest degradation efficiency of pure and doped Zinc Sulphide photocatalyst for the removal of Brilliant Green dye.
Conclusion
Cadmium and Nitrogen doped Zinc Sulphide was successfully synthesised by Mechanochemical method. The elemental doping of Cd and N in Zinc Sulphide crystal was confirmed by EDX. Hexagonal wurtzite structure of Cadmium Sulphide and decrease in crystallite size were confirmed by XRD. The UV-Visible Spectra revealed the decrease in band gap from 3.1 eV to 2.5 eV. PL spectra of mechanochemicaly prepared doped and Zinc Sulphide has the emission in blue region. The Cd and N doped Zinc Sulphide has the best degradation efficiency in sunlight as compare to UV light and a few catalyst concentration and alkaline pH has good degradation efficiency that makes the photocatalyst energy efficient and cost effective.
Conflict of Interest
There is no conflict of interest.
References
- Thakare YD, Jadhav SM (2013) Degradation of brilliant green dye using cavitation based hybrid techniques. Int J Adv Eng Tech 4: 1-6.
- Chen CC, Lu CS, Fan HJ, Chung WH, Jan JL, et al. (2008) Photocatalyzed N-de-ethylation and degradation of Brilliant Green in TiO2 dispersions under UV irradiation. Desalination 219: 89-100.
- Sohrabi MR, Ghavami M (2008) Photocatalytic degradation of Direct Red 23 dye using UV/TiO2: Effect of operational parameters. J Hazard Mater 153: 1235-1239.
- Hussein AK (2015) Applications of nanotechnology in renewable energies-A comprehensive overview and understanding. Renew Sustain Energy Rev 42: 460-476.
- Hussein AK, Walunj A, Kolsi L (2016) Applications of nanotechnology to enhance the performance of the direct absorption solar collectors. J Therm Eng 2: 529-540.
- Hussein AK (2016) Applications of nanotechnology to improve the performance of solar collectors - Recent advances and overview. Renew Sustain Energy Rev 62: 767-792.
- Li D, Li Z, Zheng Y, Liu C, Hussein AK, et al. (2016) Thermal performance of a PCM-filled double-glazing unit with different thermophysical parameters of PCM. Solar Energy 133: 207-220.
- Hussein AK, Li D, Kolsi L, Kata S, Sahoo B (2017) A review of nano fluid role to improve the performance of the heat pipe solar collectors. Energy Procedia 109: 417- 424.
- Chand R, Rana G, Hussein AK (2015) On the onset of thermal instability in a low Prandtl number nanofluid layer in a porous medium. J Appl Fluid Mec 8: 265-272.
- Yamamoto T (2003) Control of N-impurity states in N-doped ZnO, ZnS and ZnTe. Jpn J Appl Phys 42: L514-L516.
- Svob L, Thiandoume C, Lusson A, Bouanani M, Marfaing Y (2000) p-type doping with N and Li acceptors of ZnS grown by metalorganic vapor phase epitaxy. Appl Phys Lett 76: 1695-1697.
- Yang P, Lu M, Xu D, Yuan D, Zhou G (2001) Photoluminescence properties of ZnS nanoparticles co-doped with Pb2+ and Cu2+. Chem Phys Lett 336: 76- 80.
- Yang H, Holloway PH, Ratna BB (2003) Photoluminescent and electroluminescent properties of Mn-doped ZnS nanocrystals. Journal of Applied Physics 93: 586-592.
- Kudo A, Sekizawa M (2000) Photocatalytic H2 evolution under visible light irradiation on Ni-doped ZnS photocatalyst. Chemical Communications 15: 1371-1372.
- Lee S, Song D, Kim D, Lee J, Kim S, et al. (2004) Effects of synthesis temperature on particle size/shape and photoluminescence characteristics of ZnS:Cu nanocrystals. Mater Lett 58: 342-346.
- Peng WQ, Cong GW, Qu SC, Wang ZG (2006) Synthesis and photoluminescence of ZnS: Cu nanoparticles. Optical Materials 29: 313-317.
- Viswanath R, Naik HSB, Somalanaik YKG, Neelanjeneallu PKP, Harish KN, et al. (2014) Studies on characterization, optical absorption, and photoluminescence of yttrium doped ZnS nanoparticles. J Nanotechno 14: 1-8.
Open Access Journals
- Aquaculture & Veterinary Science
- Chemistry & Chemical Sciences
- Clinical Sciences
- Engineering
- General Science
- Genetics & Molecular Biology
- Health Care & Nursing
- Immunology & Microbiology
- Materials Science
- Mathematics & Physics
- Medical Sciences
- Neurology & Psychiatry
- Oncology & Cancer Science
- Pharmaceutical Sciences
