Effect of Ethonium Adsorption on Structure Formation in Nanosilica Dispersions
Olena Goncharuk, Vladimir M Gunko, Andriy Ugnivenko, Konrad Terpilowski, Ewa Skwarek and Wladyslaw Janusz
DOI10.21767/2471-9838.100029
Olena Goncharuk1*, Vladimir M Gunko1, Andriy Ugnivenko2, Konrad Terpilowski3, Ewa Skwarek3 and Wladyslaw Janusz3
1Chuiko Institute of Surface Chemistry, 17 General Naumov Street, 03164 Kyiv, Ukraine
2Department for Biotechnical Problems of Diagnostic, Institute for problems of Cryobiology and Cryomedicine, NAS of Ukraine, Prospect Nauky 42/1, Kyiv 03028, Ukraine
3Faculty of Chemistry, Maria Curie-SkÃÆââ¬Â¦Ãâââ¬Å¡odowska University, 20-031 Lublin, Poland
- *Corresponding Author:
- Olena Goncharuk
Chuiko Institute of Surface Chemistry
17 General Naumov Street, 03164 Kyiv, Ukraine
Tel: +380930922804
E-mail: iscgoncharuk@meta.ua
Received Date: Aug 23, 2017; Accepted Date: Dec 4, 2017; Published Date: Dec 6, 2017
Citation: Goncharuk O, Gunko VM, Ugnivenko A, Terpilowski K, Skwarek E, et al. (2017) Effect of Ethonium Adsorption on Structure Formation in Nanosilica Dispersions. Nano Res Appl Vol.3 No.3:12. DOI: 10.21767/2471-9838.100029
Abstract
Adsorption of ethonium on silica surface strongly affects the particle size distribution, stability and rheological properties of aqueous dispersions of fumed silica. The Sshape of isotherm of ethonium adsorption on nanosilica suggests the multilayer adsorption. The adsorption of ethonium leads to changes in the shape of the pHdependence of the zeta-potential and a significant increase in the particle sizes in the aqueous dispersions of silica. A marked increase in the colloidal stability is observed for the dispersions at silica concentration of 5 wt.%, while for 1 wt.% dispersions the ethonium presence almost does not affect the stability. The rheological properties of the dispersions depend on the ethonium concentration, and the maximum values of the viscosity and rheopectic behavior are observed at ethonium concentration of 0.1-0.3 wt.%
Keywords
Ethonium adsorption; Silica dispersion; Particle size distribution; ÃÆÃÂÃâáolloidal stability; Rheological properties
Introduction
Gemini surfactants, including quaternary ammonium salts, are used in many industrial, agricultural and medical applications [1] due to their unique physicochemical and biological properties [2,3]. These surfactants have excellent solubilizing and foaming properties [4,5], increased surface activity, extremely low critical micelle concentration (CMC) [6] and may have very low Kraft temperatures [7].
In case the surfactant adsorption onto a solid surface the structure and properties of surfactant define the interaction with the surface and the structure of the surface layer. The behaviour of surfactants at the surface is determined by number of forces, including electrostatic attraction, covalent bonding, hydrogen bonding, hydrophobic bonding and solvation of various species [8]. Usually, ionic surfactants interact with surface by electrostatic attraction between charged parts of surfactants molecules and surface hydroxyl groups.
If surfactant adsorbed on surface by single molecules, as a result, a hydrophobic monolayer of surfactant molecules is formed on the surface. The hydrophilicity of the surface decreases and can be formed the next layer of surfactant molecules, wherein the charged particles will be oriented outwards, which leads to increase of surface hydrophilicity and increasing of the surface charge.
In another case, surfactants can be adsorbed by micelles with formation of ‘fragmented bilayer’ or micellar structure at the surface. With this type of adsorption, a sharp change of properties of the system occurs upon reaching the CMC.
The interactions between components in composite systems, including aqueous dispersions, may significantly change properties of colloidal systems. Structure formation in ÃÆââ¬ËÃâÃÂolloidal dispersions is determined by the balance of surface forces in disjoining pressure formation [9]. This balance changes due to surfactant adsorption on dispersed particles. It affects the processes of structure formation in dispersions, which are characterized by particle size distribution [10], colloidal stability and structural-mechanical properties of dispersions [11]. Considering the surfactant impact on aqueous dispersions properties requires clarifying the structure formation in silica dispersions with surfactants.
One of the common gemini surfactants is ethonium (other names aethonium and etonium), i.e., 1,2- bis[dimethyl(decyloxycarbonylmethyl)aminio] ethanedichloride. Ethonium used as emulsifier, stabilizer of dispersions, floating agent and antiseptic. There is a significant amount of studies on the using ethonium in medicine [12-14], but relatively poorly studied ethonium impact on the physical and chemical properties of disperse systems.
This study was designed to estimate the influence of adsorption of gemini surfactant ethonium on the structure formation in aqueos nanosilica dispersions.
Materials and Methods
Materials
Fumed silica A-300 (pilot plant of the Chuiko Institute of Surface Chemistry, Kalush, Ukraine, specific surface area SBET= 300 m2/g) was used as the initial powder. The specific surface area of fumed silica (SBET) was calculated according to the standard BET method [15,16]. The primary particles of fumed silica are non-porous, have spherical shape and the size of 10-20 nm, only one type of functional groups - a silanol group - is presented on their surface [15,16], that makes them a convenient object for obtaining aqueous dispersions and the study of adsorption. However, it should be noted that during the pyrogenic synthesis the primary silica particles tend to form secondary structure - aggregates and agglomerates [15,17]. Therefore, for the disruption of such aggregates and agglomerates in aqueous medium the silica dispersions were sonicated for 3 min using ultrasonic disperser UZDN-A (SELMI, Ukraine, 50-70 W, frequency 22 kHz).
Ethonium (aethonium, 1,2- bis[dimethyl(decyloxycarbonylmethyl)aminio] ethanedichloride (Figure 1), Mr=585.74 Da, pharmaceutical purity) was purchased from Institute of Organic Chemistry of the NAS of Ukraine.

Figure 1: Ethonium structure.
For ethonium dissolving the phosphate buffer with pH 5 was used. For preparation of 1-liter phosphate buffer with pH 5 was used 9.5 ml Na2HPO4 × 2H2O 11.866 g/l, 990.5 ml KH2PO4 9.073 g/l and 5.65 g NaCl.
Adsorption studies
Adsorption studies were carried out under equilibrium conditions at room temperature. A certain amount of the polymer solution (from 0.05 to 0.65 wt.%) was added to 0.1 wt.% silica dispersion and stirred. The systems were equilibrated for one day. Then the silica dispersions were centrifuged. Concentration of ethonium in solution was determined using method, described in [18]: to 1 ml of the test solution was added 1 ml of bromocresol green, 5 ml of ethanol, 5 ml of acetate buffer solution (pH 3.9) and adjusted with water to 25 ml. The optical density of the solutions measured with a spectrophotometer (λ=630nm) relative to the reference solution containing no ethonium. Quantity of ethonium in the solution is determined by the calibration curve. The solutions were prepared similarly to the calibration curve containing ethonium from 25 to 625 micrograms of ethonium in 25 ml of solution.
Ethonium adsorption values were calculated from the difference in ethonium concentrations in solutions before and after contact with silica establishing the equilibrium.
Electrophoretic measurements and particle size distribution (PSD)
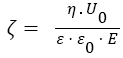
Electrophoresis studies and determination of particle size distribution were carried out using a Zetasizer 3000 (Malvern Instruments) apparatus based on photon correlation spectroscopy (PCS, λ=633nm, θ=90, software version 1.3). The aqueous dispersions of silica (0.1 wt.% for measuring particle size distribution and 0.02 wt.% for zeta-potential) were prepared using an ultrasonic disperser for 5 min (Sonicator Misonix Inc., power 500 W and frequency 22 kHz) prior to the electrokinetic measurements. NaOH and HCl were used to adjust the pH values of the dispersions. All measurements were performed at room temperature. The isoelectric point (pHIEP) of samples was determined. The measured electrophoretic mobility (UE) was converted into zeta potential (ζ) through Smoluchowski equation (for a thin electrical double layer at κa>1, where a denotes the particle radius, and κ is the Debye–Huckel parameter):
 (1)
(1)
where: ε - relative permittivity of the dispersant, ε0 - relative permittivity in vacuum, η - viscosity of liquid, E - electric field strength; U0- electrophoretic mobility.
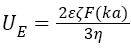
At pH close to the isoelectric point (IEP) Henry’s equation was used (for a thick electrical double layer at κa<1)
 (2)
(2)
where ε is the dielectric constant of the dispersant, F(κa) is the Henry function.
PSD with respect to the intensity of scattered light (PDSI), the particle number (PDSN) and the particle volume (PDSV) of silica alone and in the ethonium presence were studied by PCS method described in detail elsewhere [19].
Stability measurements
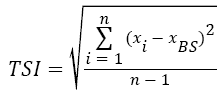
The stability measurements were carried out using a Turbiscan LabExpert with a TLAb Cooler device. The analyzed dispersion in a glass phial (7 cm in length) was placed in a thermostated chamber. The changes in the dispersion stability were monitored for 22 h (single scans were collected every 15 min). The results are shown as intensities of transmission and backscattering (in %) vs. time. These data were used to calculate the Turbiscan stability index (TSI) calculated using the programs TLab EXPERT 1.13 and Turbiscan Easy Soft:
 (3)
(3)
where xi is the average backscattering for each minute of measurement, xBS average xi, and n number of scans (repetitions of single measurement during the total time of the experiment).
The turbidimetry method is widely used for examination of stability of disperse systems [20] and provides a full and objective information about the impact of adsorption processes on aggregative and sedimentation stability [21,22].
For a quantitative estimation of stability of the dispersion system, the stability index (TSI) calculated from the curves of transmission and backscattering light scanning along the entire height of the samples is the most convenient. In this evaluation, the TSI value ranges from 0 to 100, where 0 corresponds to complete aggregative and sedimentation stability.
Rheological measurements
The rheological properties of the dispersions were studied using a rotational viscometer Rheotest 2.1 (cylinder system S/N) at a shear rate of 9-1312.2 s-1. To determine the thixotropic properties of the dispersions, the rheological measurements were performed with stepwise increasing shear rate and exposure at maximal shear rate (1312 s-1) up to a constant viscosity, and finally stepwise decreasing shear rate. The results are shown as 3D-graphs of the effective viscosity vs. the shear rate and time. This allows us to describe the destruction and restoration of the dispersion structure during the measurements. To compare different dispersions, the viscosity at the maximal shear rate (i.e., effective viscosity of the dispersion with most destroyed structure) was selected.
Aqueous dispersions of nanosilica were prepared for rheology and stability investigations using distilled water. After addition of silica to distilled water, the dispersions were sonicated for 3 min using ultrasonic disperser UZDN-A (SELMI, Ukraine, 50-70 W, frequency 22 kHz). Then an amount of ethonium solution was added to the dispersion to prepare the systems at various ratios of ethonium and silica. Rheological measurements were performed next day (to achieve the equilibrium state) after preparation of the dispersions.
Results and Discussion
Ethonium adsorption onto fumed silica
The adsorption isotherm of ethonium on the fumed silica surface from aqueous buffer solution is presented in Figure 2. A two-stage Langmuir isotherm (L4) is observed, which is similar to the isotherm of adsorption of nonionic surfactants at the solid/solution interface [23]. This form of isotherm may indicate the formation of a double layer of ethonium molecules on the silica surface [24]. The first plateau in isotherm is reached at ethonium concentration significantly above the CMC. Sharp increase of ethonium absorption was not observed at concentrations close to CMC (3.2 mmol/l, or 0.1874 wt.% [2]), therefore, on the silica surface was adsorbed individual molecules of ethonium rather than micelles. The adsorption data (Figure 2) demonstrate satisfactory agreement with the literature data [24,25]. The distance between two positive-charged nitrogen atoms in ethonium molecule is shorter (~0.384 nm) than the average distance between ≡Si-OH groups on nanosilica surface (~0.65 nm) [26,27]. Therefore, one can assume that each ethonium molecule can interact with only one ≡Si-OH group during adsorption. It was found that the ratio between the concentration of ≡SiO− groups and the number of adsorbed ethonium molecules at pH 6 close to 1:1. The authors of [24,28] consider that the ethonium adsorption mainly due to electrostatic interaction.

Figure 2: Adsorption isotherm of ethonium onto nanosilica.
The adsorption isotherm shown in Figure 2 can be divided into 3 sections. In the first section (from 0 to 0.35 × 10⁻³ mol/l) surfactant molecules adsorbed on the surface, where the number of adsorbed molecules is small, so adsorbate molecules can stay parallel to the surface. In the second section of isotherm (0.35 × 10⁻³ - 2.5 × 10⁻³ mol/l) approaching the monolayer saturation by surfactant molecules is accompanied by a gradual decrease in the slope of the adsorption isotherm. The third section (2.5 × 10⁻³ - 3.6 × 10⁻³ mol/l) corresponds to the beginning of formation of the second layer of surfactant molecules. Monolayer capacity determined at the inflection point on the isotherm and equals 8.92 * 10-9 g/g.
Particle size distribution (PSD)
For initial fumed silica the hierarchical structure is inherent: primary particles, aggregates of nanoparticles and agglomerates of aggregates [16,17], which are formed during the synthesis and storage in air. During preparation of the aqueous dispersions of silica, destruction of the initial hierarchical structure is observed to a greater or lesser degree depending on the method of suspending. The presence of electrolytes (buffer), and the adsorbed surfactant (ethonium) would influence on the structure formation in silica dispersions by changing the balance of disjoining pressure forces in the dispersion.
As it can be seen from Figure 3, there aren’t substantial differences in the particle size distribution for dispersions of initial silica in distilled water and in phosphate buffer, while the presence of ethonium appreciably effects on PSD. For ultrasound treated silica dispersions in distilled water and in buffer solution, the binary PSD is observed with maxima at 170-180 nm and 440-470 nm, which corresponds to aggregates of primary particles. In the presence of ethonium the size of the aggregates in the system increases significantly - a maximum of PSDV and PSDN is observed at D=786 nm. The increase of particle size in presence of ethonium may be caused by flocculation of silica particles due to bridging mechanism and forming mixed surfactant/silica micelles [29,30].

Figure 3: Particle size distribution by (a) particle volume and (b) particle number for the aqueous dispersions of initial silica without and with ethonium (0.3 wt.%) in buffer solution.
Zeta-potential
The pH-dependences of the zeta-potential of the silica dispersion without and with ethonium (Figure 4) show that the ethonium effect on the zeta-potential is significant. Dissociation of silanols causes the negative surface charge [19,27] and the zeta-potential is negative at pH>2. The isoelectric point corresponds to pH 2 close to the point of zero charge of silica [15,19].

Figure 4: Zeta-potential as a function of pH for the silica dispersions without and with ethonium (0.3 wt.%).
The ethonium adsorption results in changes in the electric double layer structure and pH-dependence of the zeta potential becoming more positive (pH<7) or more negative (pH>7) than that of individual silica. The electrostatic nature of the adsorption of the cationic surfactant ethonium on the negatively charged silica surface shifts zeta potential toward positive values in the pH range from 2 to 5.8, and reduces the negative zeta potential values in the pH range from 5.8 to pH 7 by compensating for the negative surface charge of silica etoniya positive charge in the pH range. Furthermore, in presence of the adsorbed surfactant layer the shift of the slipping plane is observed, and the displacement of the counter-ions in the Stern layer as a result of the surfactant adsorption takes place [31]. Adsorbed ethonium shifts the isoelectric point to pH 5.8.
Stability of dispersions
Surfactants are often used to stabilize the dispersions [4]. Upon adding a surfactant in disperse systems as a stabilizer, structural-mechanical factor of stabilization, according to Rehbinder [32], occurs by the formation of polymolecular protective layers of the micelle-forming surfactants at the interface. The interphase protective layer must be able to resist deformation and fracture sufficient mobility for the "healing" of defects encountered, and, importantly, must be lyophilized with the outer side facing the dispersion medium. The structural-mechanical barrier is a substantially comprehensive stabilizing factor, which comprises of thermodynamic, kinetic and structural components. It is versatile and able to provide high aggregative stability of disperse systems with any of the liquid dispersion medium, including highly concentrated, that is the most important from the practical point of view.
Figure 5 shows the transmission and backscattering light for 1% silica dispersions. Transmission and backscattering values are a function of the size and concentration of solid particles in the dispersion. Their change in time reflects the instability of the dispersion. The observed in Figure 5 increase in transmission in the upper part of the phial and a decrease in the bottom part indicates sedimentation bundle dispersion to form a supernatant layer with a low concentration of dispersed particles. The bundle is more for the dispersion in the absence of ethonium. Furthermore, in the absence ethonium the slight increase in particle size also observed which is manifested in a change of values transmission and backscattering for dispersion in the middle and bottom of the phial, while in the presence ethonium these values are constant. The observed features indicate stabilizing effect of ethonium on the silica dispersion.

Figure 5: Transmission and backscattering in time for 1% silica dispersion in buffer solution without ethonium and in presence of 0.03 wt.% ethonium.
Since the concentration of the solid phase is a significant factor in determining the interparticle interaction in conjunction with the adsorption of surfactant, the transmission  backscattering were studied and TSI were calculated for silica dispersions with solid phase concentration from 1 to 5 wt.% As it can be seen from Figure 6, TSI for 3 and 5 wt.% silica dispersions in a buffer in the presence of ethonium is smaller than that for the dispersions without ethonium. The stability of the initial silica dispersion is primarily determined by the electrostatic factor, i.e., negative surface charges, and the solvate shells formed around the silica particles due to the strong interaction of the surface with water molecules. These factors provide a sufficiently good stability of the nanosilica dispersions. The addition of surfactant ethonium to the silica dispersion leads to the adsorption factor affecting the stability. Noticeably this effect increases with increasing concentration of solids in the dispersion: 5 wt.% dispersions in the presence of ethonium show maximal stability and the TSI value is not more than 0.5. For 1 wt.% dispersions the difference in dispersion stability without and in presence of ethonium is not practically observed.

Figure 6: TSI index for the silica dispersions without (a) and with 0.3 wt.% ethonium (b): 1 – 1 wt.% SiO2, 2 – 3 wt.% SiO2, 3 – 5 wt.% SiO2.
Rheological properties
After adding ethonium the effective viscosity of all studied silica dispersions increases, but viscosity dependence on ethonium concentration is not simple (Figure 7). Effective viscosity reaches the maximum value at 0.3 wt.% ethonium. Ethonium influence on silica dispersions viscosity increases with the concentration of silica in the dispersion.

Figure 7: Effective viscosity at maximum shear rate (1312 s-1) of fumed silica dispersions with different concentrations of ethonium and silica.
In ethonium concentration range corresponding to maximum effective viscosity, the rheological characteristics of the dispersions change. At low ethonium concentrations (~0.05 wt.%) studied systems are thixotropic, as initial silica dispersion (Figure 8a). However, at ethonium concentration between 0.05 and 0.3 wt.%, the systems become rheopectic (Figure 8b).

Figure 8: Effective viscosity (η, mPa·s) of 5 wt.% nanosilica dispersion in phosphate buffer (ÃÆââ¬ËÃâââ¬ÃÆÃÂÃâà4.8) without ethonium (a) and in 0.13 wt.% ethonium solution (b) at different shear rates (γ, s-1).
Such extremely concentration dependence of the viscosity and simultaneous changes in the rheological behavior indicate significant changes in the particle-particle and particle-solute interactions, as well as in the structure formation. Consideration of the nature of silica-ethonium interactions and ethonium behavior in the aqueous solution is necessary to understand the mechanisms of the observed changes in the characteristics of the dispersion studied.
According to the characteristics of surfactants adsorption on silica surface, not only the size and structure of dispersed particles aggregates can change, but also hydrophilicity of surface. At low ethonium concentrations its molecules are adsorbed by electrostatic interaction between polar groups and the surface.
On the surface monolayer is formed, in which charged particles of ethonium molecules are in contact with the surface, and the hydrophobic parts in contact with solution. The surface of the silica particles becomes more hydrophobic, which leads to greater interaction between the particles of silica, and, consequently, to an increase in viscosity.
Hydrophobic surface causes further adsorption of surfactant by way, that similar to hydrophobic surfaces, that results in the formation of bilayer of surfactant molecules on the surface. As a result of this process, hydrophobicity of silica particles decreases, and the surface takes charge. Interaction between the particles of silica dispersions due to electrostatic repulsion decreases, that reduces the viscosity.
Conclusion
Adsorption of ethonium is the determining factor for the structure formation in aqueos nanosilica dispersions. Ethonium adsorption changes the structure of electrical double layer, that resulted in the change of pH-dependence of the zeta-potential, which may be caused by such effects as the charges coming from the surfactant-dissociated functional groups in the by-surface layer of the solid, the shift of the slipping plane by the surfactant molecules adsorbed on the silica surface, the displacement of the counter-ions in the Stern layer as a result of the surfactant adsorption.
In the presence of ethonium the size of the aggregates of primary particles in the system increases significantly, and the maximum of PSDV and PSDN is observed at D=786 nm. The monodisperse distribution for PSDN in the presence of ethonium may be caused by not only the aggregation of silica particles.
The stability index (TSI) for 3 and 5 wt.% dispersions of nanosilica in the phosphate buffer with ethonium is less than that for dispersion without ethonium. Adding ethonium to the silica dispersion leads to the adsorption factor affecting the stability. Noticeably this effect increases with increasing concentration of solids in the dispersion.
Amphiphilic properties of ethonium and ability to multilayer adsorption not only change effective viscosity of silica dispersions, but also change their rheological properties. Silica dispersions with 0.1-0.3 wt.% ethonium exhibit the rheopexy that is not typical for nanosilica dispersions without ethonium.
Effective viscosity of silica dispersions increases monotonically with increasing concentration of silica. Increasing concentration of ethonium to 0.3 wt.% causes increasing silica dispersions effective viscosity. Further increasing ethonium concentration leads to a decrease in the viscosity due to adsorption features of ethonium on the silica surface.
Acknowledgments
This work was supported by the People Programme (Marie Curie Actions) of the European Union's Seventh Framework Programme FP7/2007-2013 (grant no PIRSES-GA-2013-61248).
References
- Shukla D, Tyagi VK (2006) Cationic gemini surfactants: a review. J Oleo Sci 55: 381-390.
- Ostroumov SA (2001) Biological effects of surfactants. MAX Press, Moscow.
- Tawfik SM, Abd-Elaal AA, Shaban SM, Roshdy AA (2015) Surface, thermodynamic and biological activities of some synthesized gemini quaternary ammonium salts based on polyethylene glycol. J IndEngChem 30: 112-119.
- Espert A, Klitzing R, Poulin P, Colin A, Zana R, et al. (1998) Behavior of soap films stabilized by a cationic dimeric surfactant. Langmuir 14: 4251–4260.
- Rosen MJ, Tracy DJ (1998) Gemini surfactants. J Surf Deterg 1: 547-554.
- Kumar N, Tyagi R (2014) Industrial applications of dimeric surfactants: A review. J DispSciTechnol 35: 205-214.
- Rosen MJ (1999) Geminis: A new generation of surfactants. ProgChem 11: 338-357.
- Somasundaran P, Huang L (2000) Adsorption/aggregation of surfactants and their mixtures at solid–liquid interfaces. Adv Colloid Interface Sci 88: 179-208.
- Derjaguin BV, Voropayeva TN (1964) Surface forces and the stability of colloids and disperse systems. J Colloid Sci 19: 113-135.
- Adamson AW (1990) Physical chemistry of surfaces. Wiley, New York, USA.
- YalçÃÆââ¬Å¾Ãâñn T, Alemdar A, Ece ÖI, Güngör N (2002) The viscosity and zeta potential of bentonite dispersions in presence of anionic surfactants. Mater Let 57: 420–424.
- Pertsovskii AI, Kononova NS, Chukreeva LN (1990) The use of ethonium as an angioprotector in treating experimental atherosclerosis. VrachDelo 4: 103-104.
- Petrunyk IO (2000) Increased antibacterial activity of antibiotics with etoniumin vitro.MikrobiolZhurn 62: 43-46.
- Babak OI, Kushnir IE (1996) Ethonium in the treatment of patients with gastric and duodenal peptic ulcers. LikSprava3-4: 123-125.
- Gun'ko VM, Mironyuk IF, Zarko VI, Voronin EF, Turov VV, et al. (2005) Morphology and surface properties of fumed silicas. J Colloid Interface Sci 289: 427-445.
- Gun'ko VM, Mironyuk IF, Zarko VI, Turov VV, Voronin EF, et al. (2001) Fumed silicas possessing different morphology and hydrophilicity. J Colloid Interface Sci 242: 90-103.
- Eggersdorfer ML, Kadau D, Herrmann HJ, Pratsinis SE (2012) Aggregate morphology evolution by sintering: Number and diameter of primary particles. J Aerosol Sci. 46: 7–19.
- Zhebentyaev AI (1982) A method of ethoniumdeterminig. S.U. Patent No. 958931.
- Gun’ko VM, Zarko VI, Leboda R, Chibowski E (2001) Aqueous suspension of fumed oxides: particle size distribution and zeta potential. Adv Colloid Interface Sci 91: 1–112.
- WiÃÆââ¬Â¦Ãâââ¬Âºniewska M, TerpiÃÆââ¬Â¦Ãâââ¬Å¡owski K, Chibowski S, Urban T, Zarko VI, et al. (2013) Effect of polyacrylic acid (PAA) adsorption on stability of mixed alumina - silica oxide suspension. Powder Tech 233: 190–200.
- WiÃÆââ¬Â¦Ãâââ¬Âºniewska M (2013) Possibilities of colloidal silica separation from water suspension in the polyethylene glycol (PEG). Presence at different temperatures. Separation SciTechnol48: 1073-1080.
- WiÃÆââ¬Â¦Ãâââ¬Âºniewska M, TerpiÃÆââ¬Â¦Ãâââ¬Å¡owski K, Chibowski S, Urban T, Zarko VI, et al. (2013) Stability of colloidal silica modified by macromolecular polyacrylic acid (PAA) – Application of turbidymetrymethod. J Macromolecular Sci. Part A: Pure and Applied Chemistry 50: 639-643.
- Parfitt GD, Rochester CH (1983) Adsorption from solution at the solid/liquid interface. Academic press, London
- Davydenko N, Shevchenko NM, Vlasova NN, Bogomaz VI, Chuiko AA (1992) Ethonium adsorption on the surface of highly dispersed silica. Russian Journal of Physical Chemistry 66: 2778–2780.
- Paria S, Khilar KC (2004) A review on experimental studies of surfactant adsorption at the hydrophilic solid–water interface.Adv Colloid Interface Sci 110: 75-95.
- Lide DR (2003) CRC handbook of chemistry and physics. CRC Press, Boca Raton.
- Iler RK (1982) The chemistry of silica, Part 1. Wiley, New York, USA.
- Mikhailova IV, Gerashchenko II (2001) Adsorption of cationic surfactants on highly dispersed silica. Colloid J. 63: 437-440.
- Dylla-Spears R, Wong L, Miller PE, Feit MD, Steele W, et al. (2014) Charged micelle halo mechanism for agglomeration reduction in metal oxide particle based polishing slurries. Colloids Surf A: Physicochem. Eng Asp 447: 32-43.
- Du X, Wang X, You S, Wang Q, Gong X (2015) A case study of aggregation behaviors of titanium dioxide nanoparticles in the presence of dodecylbenzenesulfonate in natural water. J Environmental Sci. 36: 84-92.
- GrzÃÆââ¬Å¾Ãâââ¬Â¦dka E (2012) The adsorption layer in the system: Carboxymethylcellulose/Surfactants/NaCl/MnO2. J Surfactants Deterg 15: 513–521.
- Rehbinder PA (1958) Formation and aggregative stability of disperse systems. Colloid J USSR 20: 493-502.

Open Access Journals
- Aquaculture & Veterinary Science
- Chemistry & Chemical Sciences
- Clinical Sciences
- Engineering
- General Science
- Genetics & Molecular Biology
- Health Care & Nursing
- Immunology & Microbiology
- Materials Science
- Mathematics & Physics
- Medical Sciences
- Neurology & Psychiatry
- Oncology & Cancer Science
- Pharmaceutical Sciences