Electromagnetic Properties (Mxzn1â??X) Fe2o4 (M=Cd, Ni) Ferrites Nano Particles
Banothu Naresh*
Banothu Naresh*
Deparment of physics, Osmania University Hyderabad, India
- *Corresponding Author:
- Banothu Naresh
Deparment of physics, Osmania University Hyderabad, India
Tel: 9989105384
E-mail:banothunaresh143@gmail.com
Received Date: July 30, 2021; Accepted Date: October13, 2021; Published Date: October25, 2021
Citation: Naresh B (2021) Clinical care and healing trials, J Transl Neurosci Vol. 6 No: 5.
Abstract
The Present invegestion the chemical co-precipitation method was used to prepare a nano scale ferrite powder with Cd-Zn and Ni-Zn compositions. Ferrite, in different Cd-Zn stoichiometric ratios, showed optimal composition of saturated magnetization for Cd0.7Zn0.3Fe2O4; under an air environment and claimed at 700C, the saturated magnetization was 60.19 M(emu/g). The average particle diameter was 12 nm for the non-claimed sample, while when the sintering temperature was 800 C, the particle diameter was about 120 nm. In addition, in different Ni-Zn stoichiometric ratios, the optimal composition of the saturated magnetization was Ni0.5 Zn0.5Fe2O4; under an air environment and calcinations at 700?C the saturated magnetization was 91.40 M(emu/g). The average particle diameter for the non-claimed sample was about 12 nm, but when the sintering temperature was 700 ?C, the particle die diameter was 201.06 nm. The prepared ferrite nano-powder was characterized by scanning electron microscopy(SEM), X-ray diffraction(XRD), and vibrating sample magnetometer(VSM) to reveal its microscopic structure and related electromagnetic properties. Ferrite powders of either Cd-Zn or Ni-Zn composition can be used as catalysts for chemical reactions or iron core materials.
Keywords
co-precipitation method; Ferrite saturated magnetization.
Introduction
The origin of ferrite dates from very early in time, and it usually existed as Fe3O4, as natural ferrite. Ferrite is an oxide of strong magnetic properties, with wide applications due to the booming development of electronic technology. Nowadays, it has become an indispensable material in the electronics industry. The production of ferrite was originally made through the calcinations of an inorganic precursor material; the sintering environment and condition were controlled, as such, it is considered the earliest fine ceramic in history [1,2]. Based on the structure, ferrite can be divided into three main categories: spinal structure, garnet structure, and hexagonal structure. Methods for the preparation of ferrite can be roughly divided into: solid-state reaction, co-precipitation, sol-gel, and hydrothermal processes. The ferrites in nano crystalline form found applications in new fields, such as magnetically guided drug delivery, magnetic resonance imaging (MRI), catalysts, humidity and gas sensors, magnetic fluids, etc. Presently, ferrite core has become an indispensable inductive component in 3C products. In this work, the pure material and the co-precipitation method were used to prepare Cd-Zn and Ni-Zn ferrite nano-powders and investigate their magnetic characteristics, particle diameters, and magnetic flux densities, etc. The co-precipitation method was used at different pH values and different sintering temperatures (from 0?C to 1000?C) to synthesize [CdxZn1−x]Fe2O4, [NixZn1−x]Fe2O4 ferrite powders. Then, the effect of the pH value on crystallinity and integrity was investigated, and the effect of sintering temperature on saturated magnetization (Ms), residual magnetization (Mr), coercive force (Hc), magnetic flux (B), and average particle diameter (D) was also studied. In 2008, Ewaisn used the solid-state reaction method too prepare ZnO-MnO2-Fe2O3; as the sintering temperature increased, the saturated magnetization also increased. Moreover, as the sintering temperature increased to 950 ?C, a maximum was reached, followed by a decline. When the temperature reached 850 ?C–950 ?C, the surface morphology was transformed from the original cluster into a chain shape, and when the sintering temperature reached 950?C–1000 ?C, it was transformed into a laminating structure. For the preparation of Ni-Cd-Zn ferrite nano particles using the chemical co- precipitation method and for the study of magnetic property after sintering, high purity Ni2SO4, CdSO4, ZnSO4, and ferrous sulfate were used as precursor materials dissolved in water, with NaOH being used as the precipitation agent to form Ni0.39Cd0.11Zn0.5Fe2O4 with an obtained average particle diameter of about 25 nm. When Cu is added to ferrite, the density and magnetization can be increased. In 2011, Song et al. used strontium nitrate, nickel acetate, zinc acetate, ferric nitrate, and citric acid as precursor materials, and employed the sol-gel process to prepare ferrite nanofibers and SrFe12O19/Ni0.5Zn0.5Fe2O4 nano composite ferrite. Single Ni0.5Zn0.5Fe2O4 ultra fine fiber ferrite showed a particulate structure with a shiny surface morphology. Single SrFe12O19 ultra- fine fiber ferrite showed a pillared structure. An increase in the calcinations temperature of the nano composite SrFe12O19/Ni0.5Zn0.5Fe2O4 ferrite caused a slow change from an original nano particle into a laminating structure. When the sintering temperature reached 950 ?C, a hexagonal laminating structure with a rough surface was observed. In 2008, Deliyanni et al. used ammonias a precipitation agent and used aqueous metal precursors to prepare Mn-Zn ferrite, and an integrated spinal structure with high specific area was obtained. The average particulate diameter was in the range of 5–25 nm. The average diameter was around 17 nm. Such a crystalline structure was very close to the results obtained by the Scherer equation, that is, nanocrystals with a diameter of 13.5 nm, and such results were consistent with each other. Other authors, such as Murbe et al., prepared Ni-Cd-Zn ferrites of composition Ni1−x−yCdy Znx Fe2O4with 0.4 6≤ x 6≤ 0.6 and 0 6≤ y 6≤ 0.25 by standard ceramic processing routes and studied the effect on the sintering behavior and permeability [4].
Experimental
Materials and Measuring Tools
The sulfuric acid (H2SO4), hydrochloric acid (HCl), sodium hydroxide (NaOH), zinc(II) nitrate (Zn(NO3)2·6H2O), ferric(III) nitrate (Fe(NO3)3·9H2O), nickel nitrate, (Ni(NO3)2·6H2O), and other reagents were all G. R. grade chemicals for synthesis. A computer-interface X-ray powder diffractometer (XRD) with Cu Kα radiation (Multiflex, Rigaku, Tokyo, Japan) was used to identify the nano particles. Particle morphology was checked using a scanning electron microscope (SEM) with an accelerating voltage of 15 kV, and a field emission scanning electron microscope (FESEM, JEOL, JSM-6700F, Tokyo, Japan) was used to characterize the surface structure of the distribution of nano particles. A Vibrating Sample Magnetometer (VSM) was used to observe the nano particles electromagnetic properties. The oxygen analyzer measured the oxygen concentration .The composite particles of ferrite were prepared by sintering in a high temperature furnace [5].
Synthesis of [MxZn1−x] Fe2O4 (M=Cd or Ni)
Ionic solutions of CdSO4, Ni(NO3)2, Zn(NO3)2, and Fe(NO3)3 were mixed according to the desired stoichiometric ratio. NaOH solution was used to adjust to pH = 9. Air was passed and the solution was heated up to 70?C and left to oxidize for 24 h. Distilled water was used to repeatedly clean (5–6 times) the product to remove the salt. Then the product was placed in an oven at 110?C for 1–2 days, depending on the water content, until total evaporation was achieved. Then it was grinded on an agate mortar [6].
Results and Discussion
Ferrite can be divided into two main categories, namely, soft ferrite and hard ferrite, according to its applications. Soft ferrite is defined as having an Hc not larger than 200 Oe, when magnetization occurs; hence, the smallest externally applied magnetic field can be used to reach the maximal magnetization strength. The features of soft ferrite include a lower coercive force and higher magnetic permeability; that is, it can be easily magnetized and de-magnetized and is therefore is widely used for electronic materials. Hard d ferrite is obtained after the material is magnetized by an externally applied magnetic field, and its magnetic properties are maintained in the long term. The features of hard ferrite include a higher coercive force (the magnetic field strength for the residual magnetization is reduced to zero after the magnetic material is magnetized and de-magnetized), higher residual magnetic flux density (Br), higher residual magnetization (Mr), higher stability (to environmental variation factors, such as externally applied magnetic field and vibration), and higher maximum energy product (Bh).
In this work, a co-precipitation method was used to prepare nanoscale ferrite, and a metal solution was added with NaOH as a precipitation agent. Then, air was passed to heat up and oxidize the product so that the hydroxide was changed into ferrite with a spinel structure. was prepared at different conditions, and the effect on crystal phase, surface morphology, average particulate diameter, and magnetic properties was investigated [7].
The Influence of Different Cu and Ni Contents on the Crystal Phase of Ferrite
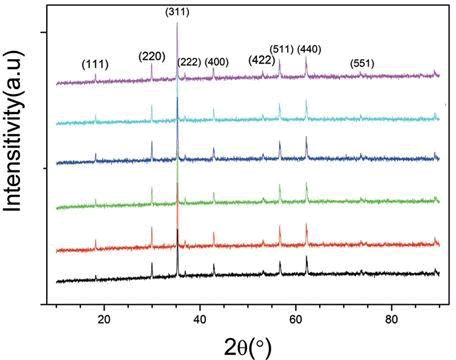
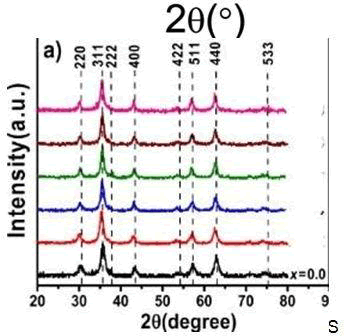
From the diffraction peaks of the XRD diffract grams of [CdxZn1−x] Fe2O4 with different Cd contents and proportions, it can be seen that the change in the proportions also affects the crystal phase strength. Cd0.7Zn0.3Fe2O4 is the most integrated and the strongest crystal phase, while Cd1Fe2O4 is the least integrated and the weakest one. Using the diffraction peaks and thee Scherer equation, the average particulate diameter was calculated. It can be seen that the particulate diameter changed along with the strength of the crystal phase. For a composition of Cd0.7Zn0.3Fe2O4, with the strongest strength of crystal phase, the average particulate diameter was also the largest (22.32 nm). For the composition of Cd1Fe2O4, the strength of the crystal phase was the weakest, and the average particulate diameter was the smallest (only 4.66 nm). Figure 2a shows the XRD diagram with different proportions of [CdxZn1−x]Fe2O4 sintered at500 ?C. For different proportions, sintering at 500?C (temperature increase of 4 ?C/min, and kept at constant temperature for 2 h) was used to enhance the crystal phase and facilitate comparison. From the figure, it can be seen that when the Zn content was to low, Cd in [CdxZn1−x] Fe2O4 could be easily transformed into CdO, and when the Zn content was zero, The strength of the crystal phase of Cd was stronger
Figure 1 shows [NixZn1−x] Fe2O4 ferrite. The proportion of Ni and Zn was changed to investigate the differences in the crystal phase. From the diffraction peaks, it can be seen that the change of the proportion also affects the strength of the crystal phase. The samples with strongest crystal phases were Ni0.36Zn0.64Fe2O4, Ni0.5Zn0.5Fe2O4, and Ni0.64Zn0.36Fe2O4 ferrite, the saturated magnetization of these three sets of proportions was relatively stronger. The diffraction peaks were then used to calculate the particulate diameter that was in the range of 10.92 nm to 19.6 nm. The average particulate diameter of Ni0.5Zn0.5Fe2O4 [8,9,10]. ferrite was the largest (about 19.60 nm). This was because Ni0.5Zn0.5Fe2O4 ferrite, as it can be seen from the XRD results, exhibited the most integrated and the strongest crystal phase. Ni0.2Zn0.8Fe2O4 ferrite had the smallest particulate diameter of 110.92 nm to
19.6 nm the average particulate diameter of Ni0.5Zn0.5Fe2O4 ferrite was the largest (about 19.60 nm). This was because Ni0.5Zn0.5Fe2O4 ferrite, as it can be seen from the XRD results, exhibited the most integrated and the strongest crystal phase. Ni0.2Zn0.8Fe2O4 ferrite had the smallest particulate diameter of 10.92 nm. It can be seen from the XRD results that the crystal phase strength of this composition and proportion was the weakest.
Scanning Electron Microscopy
Surface morphology and average grain size of Cd2+ substituted Ni1−??Cd??Fe2O4 NPs were determined by using analytical scanning electron microscope by selecting 10,000 magnification range. SEM images (Figure 3) of typical samples (?? =0.2 and 0.6) shows the nanocrystalline nature of Ni1−??Cd??Fe2O4 NPs with vivid pores suggesting it as more advantages for the gas sensing applications. Voids and pores present in Ni1−??Cd??Fe2O4 NPs can be attributed to the release of gases during the combustion process and lesser the dense nature. Intergranular diffusion can be clearly seen in SEM images of the NPs. Fused grain nature can be seen in ?? = 0.2, whereas ?? = 0.6 looks comparatively more crystalline affecting the spin coupling in Ni1−??Cd??Fe2O4 NPs which is at the base of the magnetic behavior.[11].
The Influence of Different Cu and Ni Contents on Magnetic Properties
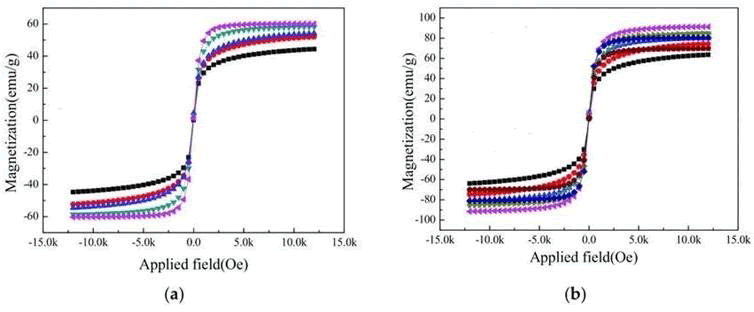
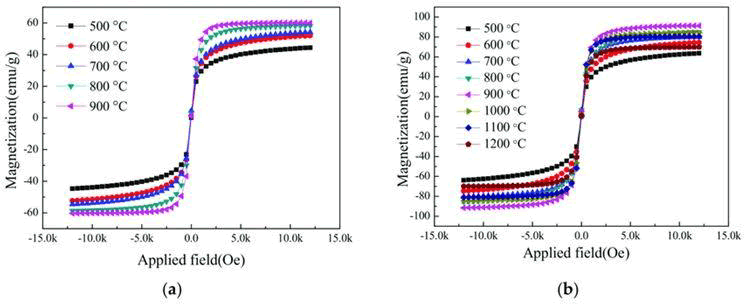
Along with the change in the size and direction of the externally applied magnetic field, the magnetization state of the material started to deflect; after de-magnetization, the magnetic domain can return to its origin. The B, H slope caused by such a reversible boundary movement is called the initial permeability. When the magnetic field continues to increase and changes into an irreversible state, magnetization finally will reach saturation; at this moment, even if the externally applied magnetic field is enhanced, the magnetization strength cannot be increased. After magnetization reaches saturation, if the externally applied magnetic field is removed, some magnetic c domains will remain the same with remanent magnetization (Br). If at this moment, a reverse magnetic field is added, then magnetization will, at coercive force (Hc), be reduced to zero. If the reversed externally applied magnetic field is continuously increased, the material will reach a saturated magnetization state that is the reverse of the original magnetization direction. When the externally applied magnetic field has cycled once from the positive direction to the negative direction, a hysteresis curve will be generated . Figure 3a shows.
the hysteresis curve for [CdxZn1−x] Fe2O4 at different compositions and proportions. From the figure, it can be seen that saturated magnetization was 15.30 M(emu/g) for the composition and proportion of Cd0.5 Zn0.5Fe2O4. As the Cd content increased, saturated magnetization also increased. When the Cu content reached Cd0.7Zn0.3Fe2O4, the saturated magnetization also reached a peak of
24.89 M(emu/g), and the crystal phase was the strongest too; later on, as the Cd content increased, the saturated magnetization decreased accordingly. When the Cd content reached the composition of Cd1Fe2O4, the saturated magnetization was the lowest, only 1.20 M(emu/g), and its crystal phase was also the weakest.
(a) [CdZn1-x]Fe2o4; (b) [NixZn1-x]Fe2O4
Concerning the Ni-Zn system, Figure 3b shows that Ni0.5Zn0.5Fe2O4 ferrite had the optimal magnetization, which was 50.29M(emu/g), and its crystal phase was the strongest.
Ni0.3Zn0.7Fe2O4s ferrite was the worst, at only about 1.86 M(emu/g), and its crystal phase was relatively weaker as well. Therefore, it is clear that the strength of the crystal phase affect the magnetization of ferrite; however, the product with the worst crystal phase will not have the worst magnetization.
Table1 depicts the coercive force (Hc), saturated magnetization (Ms), and residual magnetization (Mr) of [CdxZn1−x]Fe2O4 at different proportions. From the data, it can be seen that the magnetic characteristic and Hc values for different proportions did not exceed 200 Oe, and the Mr value (soft ferrite had lower remnant magnetization) approached zero. Therefore, we can be sure that we are dealing with soft ferrite. For the magnetic flux of [CdxZn1−x]Fe2O4 at different compositions and proportions, from the formula, the units of magnetic flux (B) are gauss, and the table shows that the magnetic flux for Cd0.5Zn0.5 was 186.12 gauss/g; as the Cd content increased, the magnetic flux increased accordingly. When the composition was Cd0.7Zn0.3, it reached a peak of 306.39gauss/g; later on, it dropped, since for Cd1Fe2O4, the magnetic flux was only 15.47 gauss/g. In terms of coercive force (Hc), saturated magnetization (Ms), and remnan magnetization (Mr) for [NixZn1−x]Fe2O4 ferrite with different proportions, the experimental results show that the magnetic characteristic and Hc values did not exceed 200 Oe, and the Mr value approached zero. Therefore, we can be sure that we are dealing with soft ferrite in this series. For the magnetic flux of [NixZn1−x]Fe2O4 ferrite, further calculations from the formula showed that the units of magnetic flux (B) were gauss. From the results, it can be seen that the magnetic flux for Ni0.2Zn0.8 was 61.18 gauss/g. For Ni0.3Zn0.7, the magnetic flux dropped to 14.00 gauss/g; later on, as Ni content increased, the magnetic flux also increased. When the composition was Ni0.5Zn0.5, it reached a peak of 624.48 gauss/g, but when the composition was Ni0.64Zn0.36, the magnetic flux decayed to 416.06 gauss/g. This trend was the same as the magnetic flux trend described in the literature [12,13]. The magnetic flux increases with the rise in Ni2+ ions concentration
| Composition | Properties Magnetic | Hc(Oe) | Ms (emu/g) | Mr (emu/g) | (gauss/g) |
|---|---|---|---|---|---|
| Cd-Zn system | Cd0.5Zn0.5 | -6.05 | 15.3 | 0.03 | 186.12 |
| Cd0.6Zn0.4 | 12.48 | 18.41 | 0.09 | 218.75 | |
| Cd0.7Zn0.3 | 6.23 | 24.89 | 0.15 | 306.39 | |
| Cd0.8Zn0.2 | 5.87 | 22.42 | 0.12 | 275.74 | |
| Cd0.9Zn0.1 | 4.25 | 1.62 | 0.01 | 16.05 | |
| Cd1Fe2O4 | 0.35 | 1.20 | 0.00 | 15.47 | |
| Composition | Properties Magnetic | Hc(Oe) | Ms(emu/g) | Mr(emu/g) | B(gauss/g) |
| Ni-Zn system | Ni0.2Zn0.8 | -17 | 6.24 | -0.01 | 61.18 |
| Ni0.3Zn0.7 | -9 .35 | 1.86 | 0 | 14 | |
| Ni0.36Zn0.6 | -6.91 | 11.54 | -0.04 | 108.04 | |
| Ni0.5Zn0.5 | -7.16 | 50.29 | -0.34 | 624.48 | |
| Ni0.64Zn0.36 | -11.23 | 34.02 | s -0.32 | 416 |
Table1: The hysteresis curve for [MxZn1−x] Fe2O4 at different compositions and proportions; Hc: Coercive force; Ms: Saturated magnetization; Mr: Residual magnetization; B: Magnetic flux
The Effect of the Sintering Temperature on the Crystal Phase of [CdxZn1−x] Fe2O4 and [NixZn1−x] Fe2O4
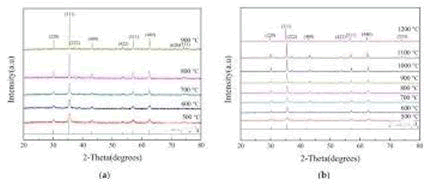
Figure4a shows the XRD diagram of Cd0.7Zn0.3Fe2O4 at different sintering temperatures. The material was sintered in an air atmosphere, at 5?C/min, and after a constant temperature maintained for 2 h the furnace was cooled. From the experimental results, it is clear that as the sintering temperature increased, the crystal phase became more integrated and its strength became stronger. Under the air sintering temperature and atmosphere, part of it suffered thermal decomposition due to over- heating; therefore, nitrogen was not needed in the sintering process. For the ferrite composition of Cd0.7Zn0.3Fe2O4, using the diffraction peaks at different sintering temperatures and the Scherer equation, the average particulate diameter was calculated. And as temperature increased, the original particulate diameter of 24.65 nm at 500 ?C increased to 94.46 nm at 900 ?C. Thus, as the temperature increased, the particulate diameter also increased. Figure 4b shows the e XRD diagram of Ni0.5Zn0.5Fe2O4 at different sintering temperatures, sintered in an air atmosphere at 5 ?C/min, held at a constant temperature for 2 h, and finally furnace-cooled. The experimental results show that as the sintering temperature increased, the crystal phase became more integrated and its strength became stronger. This was unlike the [MxZn1−x]Fe2O4 system under air atmosphere, as when the sintering temperature was too high, thermal decomposition occurred. Therefore, N2 was notneeded for sintering. For Ni0.5Zn0.5Fe2O4 ferrite at different sintering temperatures, the diffraction peaks were used to calculate the average particulate diameters, and it was seen that the particulate diameter increased with the temperature increase. The particulate diameter r increased from the original 20.31 nm at 500 ?C to 201.06 nm at 1200 ?C. The XRD diagram confirmed the single crystalline phase of the nano particles. The lattice parameter decreased with the increase in Ni content and reduced Lattice strain
The Effect of Sintering Temperature on the Magnetism of [CdxZn1−x] Fe2O4, [NixZn1−x]Fe2O4 Ferrite
Figure 5a shows the hysteresis curve of Cd0.7Zn0.3Fe2O4 at different temperatures, sintered in an air atmosphere at 5 ?C/min, held at a constant temperature for 2 h, and finally furnace-cooled. It can be seen that the worst saturated magnetization occurred at 500 ?C, only 44.56 emu/g. However, as sintering temperature increased, the saturated magnetization also increased. When the sintering temperature reached 900 ?C, the saturated magnetization reached a peak of 58.40 emu/g. For Cd0.7Zn0.3Fe2O4, the change of the saturated magnetization with the temperature was not as large as that observed for [MnxZn1−x]Fe2O4 and [NixZn1−x]Fe2O4. Figure 5b shows the hysteresis curve for Ni0.5Zn0.5Fe2O4 ferrite at different sintering temperatures. It can be seen that the saturated magnetization was worse at 500 ?C: 63.70 M(emu/g). As the sintering temperature increased, the saturated magnetization also increased, and when the sintering temperature reached 900 ?C, the saturated magnetization reached a peak of 91.40 M(emu/g). Above 900 ?C, the saturated magnetization started to decay, and when the sintering temperature reached 1200 ?C, the saturated magnetization was only 69.92(emu/g).
| Composition/Temperature,?C | Properties Magnetic | Hc (Oe) | Ms(emu/g) | Mr(emu/g) | B (gauss/g) |
|---|---|---|---|---|---|
| Cu0.7Zn0.3Fe2O4 | 500 | 3.32 | 44.56 | 0.16 | 562.99 |
| 600 | 23.92 | 52.24 | 1.33 | 680.05 | |
| 700 | 75.69 | 54.39 | 4.58 | 758.83 | |
| 800 | 47.78 | 58.4 | 3.16 | 781.28 | |
| 900 | 17.42 | 60.19 | 1.33 | 773.41 | |
| Composition/Temperature,?C | Properties Magnetic | Hc (Oe) | Ms(emu/g) | Mr(emu/g) | B (gauss/g) |
| Ni0.5Zn0.5 Fe2O4 | 500 | 1.55 | 63.7 | 0.09 | 801.96 |
| 600 | 31.98 | 74.64 | 2.43 | 968.96 | |
| 700 | 71.79 | 80.2 | 6.7 | 1079.1 | |
| 900 | 45.74 | 91.4 | 5.08 | 1193.72 | |
| 1000 | 22.29 | 84.68 | 2.17 | 1085.87 | |
| 1100 | 4.06 | 80.72 | 0.43 | 1017.9 | |
| 1200 | 8.11 | 69.92 | 0.67 | 886.31 |
Table2 shows the coercive force (Hc), saturated magnetization(Ms), and remnant magnetization (Mr) at different sintering temperatures for [CdxZn1−x]Fe2O4. For Cd0.7Zn0.3Fe2O4, it can be seen that at different temperatures, the magnetic characteristic and Hc value did not exceed 200 Oe and the Mr value approached zero (soft ferrite had lower remnant magnetization). Therefore, we can be sure that this series of ferrite was composed of soft ferrites. For the magnetic flux of [CuxZn1−x]Fe2O4 at different sintering temperatures, further calculations showed that the magnetic flux (B) increased from 562.99 gauss/g at 500 ?C to 773.41 gauss/g at 700 ?C as the temperature increased. Moreover, a peak of 781.28 gauss/g was seen at 800 ?C, while at 900 ?C, due to the smaller Hc value, the magnetic flux showed a small drop to 773.41 gauss/g. For Ni0.5Zn0.5Fe2O4 ferrite, the magnetic properties at different temperatures could be obtained, the Hc values did not exceed 200 Oe, and the Mr values approached zero (soft ferrite had lower remnant magnetization). Therefore, this series was also confirmed to be composed of soft ferrites. Moreover, magnetic fluxes (B) at different sintering temperatures increased from 801.62 gauss/g at 500 ?C along with the temperature increase. When the temperature reached 900 ?C, it reached a peak of 1193.72 gauss/g; later on, it started to drop, and when the temperature reached 1200 ?C, the magnetic flux was 886.31 gases/g
Surface Morphology Analysis of [CuZn]Fe2O4
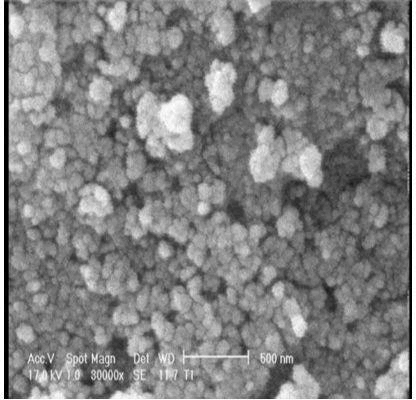
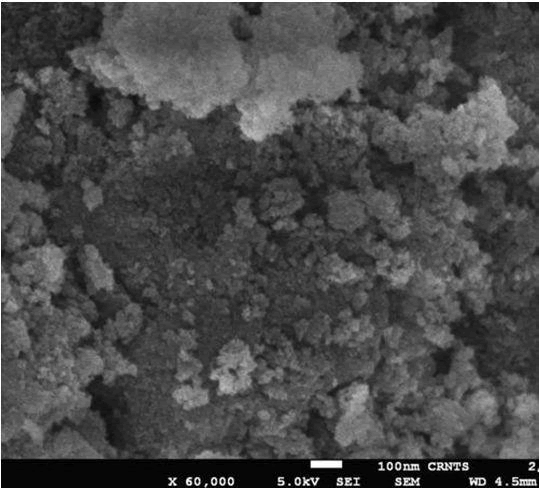
Figure 6 shows the surface morphologies of Cu0.7Zn0.3Fe2O4 at different sintering temperatures, in an air atmosphere at 5 ?C/min, held at a constant temperature for 2 h, and lastly cooled. It can be seen that the non-sintered powder had very small particulate diameter, and the average particulate diameter was about 10 nm. When sintering temperature increased to 500 ?C, the SEM image showed that there was no significant difference, and the average particulate diameter was still about 20 nm. When sintering temperature was 600 ?C, there was also no significant difference, as the average particulate diameter was still about 25 nm. At 700 ?C, it can be seen that the primary particle started to grow significantly larger, and the average particulate diameter approached 50 nm. When the sintering temperature was 800 ?C, the primary particles started to crystallize to form secondary particles, and the average diameter approached 70 nm. At 900 ?C, the phenomenon of crystallization into secondary particles was more significant than that observed at 800 ?C, and the average particulate diameter reached about 150 nm. In the observation of non-sintered Cu0.7Zn0.3Fe2O4 micro-structure, since the non-sintered powder has a very fine average particulate diameter, even on the SEM images with a 50,000× amplification the average particulate diameter could not be seen. From the 100,000× SEM image, it can be clearly seen that the average particulate diameter was about 10 nm. The electronic data systems(EDS) composition analysis showed that ferrite powder was an alloy formed by four elements; Mn, Zn, Fe, and O, and that no other metal atoms were present. Meanwhile, the proportion was correct, proving that, when neutralized, the metal ions were completely precipitated.
Surface Morphology Analysis of [NixZn1−x] Fe2O4
Figure7 shows the surface morphology of Ni0.5Zn0.5Fe2O4 ferrite at different sintering temperatures, under an air atmosphere at 5 ?C/min, held at a constant temperature for 2 h, and then furnace-cooled. From the figure, it can be seen that the non-sintered powder had a very small particulate diameter; the average diameter was about 10 nm. When the sintering temperature increased to 500 ?C, the SEM image showed that there was no significant difference, as the average particulate diameter was still about 10 nm. When the sintering temperature increased to 600 ?C, the average particulate diameter increased a little, and was about 20 nm. When the sintering temperature increased to 700 ?C, there was not much difference from the product sintered 600 ?C, as the average particulate diameter was still about 20 nm. When the sintering temperature increased to 800 ?C, the average particulate diameter became significantly larger than that sintered at 700 ?C, being about 30 nm. When the sintering temperature was 900 ?C, the primary particles precipitated.
y particles started to cluster, and some had already associated into secondary particles, with an average particulate diameter of about 50 nm. When temperature increased to 1000 ?C, the primary particles started to cluster, and a massive amount of primary particles had already associated into secondary particles, the average diameter being 60 nm. At 1100 ?C, it could be seen that secondary particles crystallized in massive amounts. At 1200 ?C, secondary particles started to crystallize massively, and the crystallized particles were already larger than those crystallized at 1100 ?C; the crystalline surface was filled with many particles with a size of about 200 nm. Ni0.5Zn0.5Fe2O4 is shown in the figure with 100,000× amplification on the field emission scanning electron microscope (FESEM). After comparison of the non-sintered product (a) and that sintered at 500 ?C (b), it can be seen that the nano particles sintered at 500 ?C were larger than the non-sintered ones by 2–3 nm. Table 3 shows the mean diameter of the Cu0.7Zn0.3Fe2O4 and Ni0.5Zn0.5 Fe2O4 are correlated with the SEM and XRD size estimations according to the thermal treatments. The mean diameter of the two compositions with the same sintering temperature trend is the same. The EDS composition analysis of Ni0.5Zn0.5Fe2O4 showed that ferrite power was an alloy of Ni, Zn, Fe, and O. There were no other metallic ions present, and the proportion was correct, which proves ions present, and the proportion was correct, which proves that in the neutralization reaction process the metallic ions were completely precipitated
| Temperature,?C/ Mean | Cu0.7Zn0.3Fe2O4 | Ni0.4Zn0.5Fe2O4 |
|---|---|---|
| Diameter | XRD SEM | XRD SEM |
| 500 | 24.65 20 | 20.31 10 |
| 600 | 30.36 25 | 37.77 20 |
| 700 | 38.89 50 | 38.66 20 |
| 800 | 50.50 70 | 59.05 30 |
| 900 | 94.46 150 | 74.86 50 |
| 1000 | - - | 91.86 60 |
| 1100 | - - | 105.6 120 |
| 1200 | - - | 201.06 250 |
Table2: The effect of sintering temperature on the mean diameter.
Conclusion
After summarizing the experimental results obtained from [CdxZn1−x]Fe2O4 and [NixZn1−x]Fe2O4, the following conclusions can be obtained: for different compositions of Cd-Zn and Ni-Zn ferrites, the sintering temperatures for optimal saturated magnetization values were quite different. For the [CdxZn1−x]Fe2O4 system, the optimal sintering temperature was 900 ?C, and the saturated magnetization was 60.19 M(emu/g). For the [NixZn1−x]Fe2O4 system, the optimal sintering temperature was also 900 ?C, but the saturated magnetization was 91.40 M(emu/g). The material with the saturated magnetization most seriously affected by the sintering temperature was [NixZn1−x]Fe2O4, and the difference between the maximal and minimal values was 41.11 M(emu/g). However, for the [CdxZn1−x]Fe2O4 system, the difference between the maximal and minimal value was 35.30 M(emu/g). The size of the remnant magnetization depended on the preparation conditions, and there was no relative relationship between the size of the saturated magnetization and the size of the remnant magnetization. Moreover, there was no relative relationship between the size of the saturated magnetization and the size of the coercive force. Both for Cd-Zn and Ni-Zn ferrites, the coercive force did not exceed 200 Oe; thus, both materials were soft ferrites. From VSM and XRD results for the different compositions, it can be seen that, for all kinds of systems and all proportions, the sintering atmosphere and sintering temperature—before the drop of the saturated magnetization—indicated that the stronger the crystal phase strength, the stronger the saturated magnetization. For [CdxZn1−x]Fe2O4 and [NixZn1−x]Fe2O4 ferrites at different sintering temperatures, the crystal phase strength of XRD was affected; the higher the sintering temperature, the stronger the crystal phase. For the material with a stronger crystal phase, SEM showed that the average particulate diameter was also larger, and when the sintering temperature was higher, the average particulate diameter was larger. It can be clearly seen from the SEM photos that, for non-sintered to sintered at 900?C Cd-Zn and Ni-Zn ferrites, the one with the maximal change on the average particulate diameter due to sintering temperature was [CdxZn1−x]Fe2O4, and the average particulate diameter changed from 10 nm to 150 nm; for the [NixZn1−x]Fe2O4 system, the average particulate diameter change was in the range of 10–50 nm.
References
- Smite, J.; Win, H.P.J. Ferrites; Philips Technical Library: Eindhoven, The Netherlands, 1959.
- Murdock, E.S.; Simmons, R.F.; Davidson, R. Roadmap for 10 Grit/in2 Media: Challenges. IEEE Trans. Man. 1992, 28, 3078–3083. [Crossruff]
- Stasndley, K.J. Oxide Magnetic Materials, 2nd ed.; Oxford University Press: Oxford, UK, 1972
- Emad, M.M.E.; Mahmoud, M.M.; Abdel-Hady, E.A. In-Situ synthesis of Magnetic Mn-Zn Ferrite ceramic object by solid state reaction. J. Aust. Ceram. Soc. 2008, 44, 57–62
- Zheng, Z.G.; Zhong, X.C.; Zhang, Y.H.; Yu, H.Y. Synthesis structure and magnetic properties of nanocrystalline ZnxMn1-xFe2O4 prepared by ball milling. J. Alloys Comp. 2008, 466, 377–382. [CrossRef]
- Ammad, Q.H. The influence of hafnia and impurities (CaO/SiO2 ) on the microstructure and magnetic properties of Mn-Zn ferrites. J. Cryst. Growth 2006, 286, 365–370.
- Upadhyay, C.; Verma, H.C.; Rath, C.; Sahu, K.K.; Anand, S.; Das, R.P.; Mishra, N.C. Mossbauer studies of nanosize Mn1-xZnxFe2O4 . J. Alloys Comp. 2001, 326, 94–97. [CrossRef]
- Arulmurugan, R.; Vaidyanathan, G.; Sendhilnathan, S.; Jeyadevan, B. Mn-Zn ferrite nanoparticles for ferrofluid preparation: Study on thermal-magnetic properties. J. Magn. Magn. Mater. 2006, 298, 83–94. [CrossRef]
- Peng, X.; Peng, K.; Huang, J. Synthesis and magnetic properties of core-shell structured Finemet/Ni-Zn ferrite soft nanocomposites by co-precipitation. J. Alloys Comp. 2017, 691, 165–170. [CrossRef]
- Mane, D.R.; Patil, S.; Birajdar, D.D.; Kadam, A.B.; Shirsath, S.E.; Kadam, R.H. Sol-gel synthesis of Cr3+ substituted Li0.5Fe2.5O4 :cation distribution, structural and magnetic properties. J. Mater. Chem. Phys. 2011, 126, 755–760. [CrossRef]
- Song, F.; Shen, X.; Liu, M.; Xiang, J. Preparation and magnetic properties of SrFe12O19/Ni0.5Zn0.5Fe2O4 nanocomposite ferrite microfibers via sol-gel process. J. Mater. Chem. Phys. 2011, 126, 791–796. [CrossRef]
- Ghoul, E.; Kraini, M.; Lemine, O.M.; Mir, L.E. Sol–gel synthesi s, structural, optical and magnetic properties of Co-doped ZnO nanoparticles. J. Mater. Sci. Mater. Electron. 2015, 26, 2614–2621. [CrossRef]
- Pozo, G.L.; Silvetti, S.P.; Aguirre, M.C.; Condo, A.M. Synthesis and characterization of (NiZnFe2O4)0.5/(SiO2 )0.5 granular nanocomposites. J. Alloys Comp. 2009, 487, 646–652. [CrossRef]S 14. Lu, X.; Zhou, T.; Jia, M. Hydrothermal synthesis of Mn-Zn ferrites from spent alkaline Zn-Mn batteries
Open Access Journals
- Aquaculture & Veterinary Science
- Chemistry & Chemical Sciences
- Clinical Sciences
- Engineering
- General Science
- Genetics & Molecular Biology
- Health Care & Nursing
- Immunology & Microbiology
- Materials Science
- Mathematics & Physics
- Medical Sciences
- Neurology & Psychiatry
- Oncology & Cancer Science
- Pharmaceutical Sciences
