Oxidation Rate of Fe Nanoparticles
Williams AG, Evans AW, Liu L, Johnson CE2 and Johnson JA
Department of Biomedical Engineering, University of Tennessee Space Institute Tullahoma, Tennessee
Received Date: 2022-04-01 | Published Date: 2022-04-29DOI10.36648/2471-9838.8.4.43
Williams AG1*, Evans AW1, Liu L2, Johnson CE2 and Johnson JA1,2
1Department of Biomedical Engineering, University of Tennessee Space Institute, Tullahoma, Tennessee
2Center for Laser Applications, University of Tennessee Space Institute, Tullahoma, Tennessee
- *Corresponding Author:
- Williams AG
Department of Biomedical Engineering, University of Tennessee Space Institute, Tullahoma, Tennessee
E-mail:awill242@vols.utk.edu
Received date: April 01, 2022, Manuscript No. IPNRA-22-12959; Editor Assigned date: April 04, 2022, PreQC No. IPNRA-22-12959(PQ); Reviewed date: April 19, 2022, QC No. IPNRA-22-12959; Revised date: April 25, 2022, Manuscript No. IPNRA-22-12959(R); Published date: April 29, 2022, DOI: 10.36648/2471-9838.8.4.43
Citation: Williams AG (2022) Oxidation Rate of Fe Nanoparticles. Nano Res Appl Vol.8 No.4:43
Keywords
Magnetic iron nanoparticles; Magnetic particle imaging; Magnetic resonance imaging; Mössbauer spectroscopy; PEG coating
Introduction
Nanoscience has now become a staple in science and continues to grow. Nanoscience is considered to be one of the most important research areas today. It allows engineers, scientists, and physicians to develop advances in medicine, industry, and energy conversion. Nanoparticles can be used for nanomedicine [1], environmental remediation [2], nano-sensors [3], energy storage devices [4], and much more. Magnetic Nanoparticles (MNPs) are of special interest due to their biomedical applications including biosensors, medical imaging, and hyperthermia [5,6]. Iron based nanoparticles are magnetic nanoparticles which are used extensively in health and technology applications. They are of interest for use in Magnetic Particle Imaging (MPI) as tracers because they generate a signal under an applied magnetic field [7]. This signal is then processed, and an image is formed from the data. The benefits of MPI are depth independence, and the ability to collect 2D and 3D images without tissue attenuation [8]. Research currently being completed with MPI and MNPs includes homing of circulating tumor cells, tracking tumor associated inflammation, monitoring chemotherapy concentrations, and magnetic hyperthermia [9,10]. Although iron oxide nanoparticles have shown promise in biomedical imaging, the magnetic properties can still be improved. Compared to iron oxides, pure iron nanoparticles possess improved saturation magnetization and coercivity, which generates higher magnetic signals for imaging modalities. Such properties allow iron nanoparticles to provide a stronger shortening effect on T2 relaxation of proteins, which allows for improved contrast enhancement in MRI application [11,12]. Since the contrast quality in MRI is controlled by the amount of iron content delivered per unit volume, pure iron nanoparticles can provide higher quality contrast compared to iron oxide agents. Nanoparticles with higher iron content compared to iron oxide nanoparticles are also favorable in MPI tracer applications, since MPI relies on the direct detection of iron magnetization [13]. MPI, compared to MRI, is requires a tracer, which provides a positive contrast that allows for quantitative and background-free imaging [14]. In order to achieve high spatial resolution and signal intensity, MPI tracers must possess high magnetization saturation. Therefore, since iron contains greater magnetic saturation compared to iron oxide, pure iron nanoparticles will yield better signal intensity when used in MPI applications [15]. In addition, since iron content concentration would be higher in pure iron nanoparticles, administered dosage amounts could be decreased, resulting in improved safety for the patient and easier removal of the substance from the body post-imaging. Imaging time could also be reduced, thus increasing overall patient comfort.
The most significant concern in the use of MNPs in the body is how they affect the biological environment. There are many factors which must be considered during synthesis including how shape, size, surface properties, and colloidal stability can affect biocompatibility of the NPs [16]. Metallic iron nanoparticles are particularly susceptible to oxidation after synthesis due to the high surface energy pure Fe possesses [17]. This is depends on grain size and the amount of oxygen in the environment. Moreover, oxidation can result in faster degradation of the nanoparticle and result in the production of oxidative radicals. These can cause damage to tissue because of oxidative reactions with lipids and proteins [18].
Coating nanoparticles has been known to improve surface properties and reduce complications of direct interaction of the nanoparticles and the biological environment. A Polyethylene Glycol (PEG) coating can be applied to improve biocompatibility and prevent oxidation before entry into the body [19]. Maintaining the pure iron properites of the nanoparticles is important during MRI or MPI imaging in order to obtain higher contrast or resolution respectively. Therefore, coating the nanoparticles with a protective polymer coating is imperative to preventing oxidation before and after injection into the body during the imaging time, which can range from 30 minutes-90 minutes depending on the areas being imaged [20]. However, once imaging is complete, oxidation of the iron nanoparticles to iron oxide within the body is desired, to comply with current Federal Drug Administration approvals. Oxidation allows safe processing and excretion of the nanoparticles out of the body. While iron nanoparticles have been synthesized in matrices [21,22], preparing them as a powder, which can be dispersed in a colloid solution for biomedial applications, has proved elusive. In this paper, oxidation rate and chemical changes that occur in iron nanoparticles, both coated and uncoated, are explored. We report measurements of oxidation of these particles using Mössbauer spectroscopy with the aim of producing metallic particles for improved imaging and safety in biomedical applications.
Experimental Methods
Chemicals
The chemicals utilized in the synthesis of metallic iron nanoparticles included metallic iron (III) chloride (alfa aesar, reagent grade 97%), sodium borohydride (sigma aldrich, reagent grade 99.99%), argon gas, Deionized (DI) water, and polyethylene glycol 300 weight (sigma aldrich).
Synthesis of FeNPs
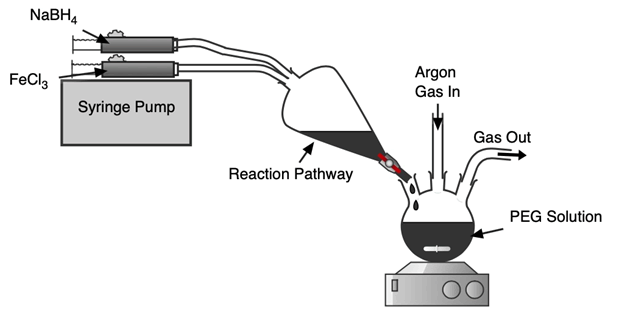
A schematic of the synthesis setup can be seen in Figure 1. Metallic iron nanoparticles were synthesized by the reduction of iron (III) chloride with sodium borohydride. 1.407 g of FeCl3 was dissolved in 15 ml of DI water and the reducing agent was prepared by dissolving 0.681 g of NaBH4 in 15 ml DI water. Two syringes were filled with each mixture and placed on a syringe pump system to pump the two reactant mixtures equally at 15 ml/min. The reactants were pumped and processed in a separatory funnel that acted as a reaction pathway to form iron nanoparticles. The particles then fell into a three-neck round bottom flask flask under Ar blanket and magnetic stirring in a PEG 300 and DI water mixture for coating.
Two separate syntheses were performed, differing by the addition of PEG 300 to coat one set of particles. Upon completion of the syntheses, two types of particles were obtained. The first were uncoated particles that were labeled U. The second were coated particles which were labeled C: Synthesis for C1 included 300 µL PEG 300 in 20 ml DI water, while C2 included 600 µL PEG 300 in 20 mL DI water.
Both the coated and uncoated particles were washed 3 times with 30 ml of DI water before vacuum filtration and oven drying under an argon atmosphere at 50°C overnight. The particles were crushed into powders after drying and were kept in an argon filled glovebox until characterizations (Figure 1).
Characterization
Powder X-ray Diffraction (XRD). XRD measurements were performed using a Rigaku smart lab X-ray diffractometer with a Cu Kα X-ray source in a 2θ range from 20° to 80°.
Transmission Electron Microscopy (TEM) and Energy Dispersive X-Ray Spectroscopy (STEM-EDS): TEM and EDS measurements were performed using an FEI Tecnai Osiris TEM operating between 80 kV-200 kV. The dried nanoparticles were dispersed in isopropanol and ultrasonicated for 10 minutes before dropping the dispersion onto a 300-mesh carbon coated copper grid. Diameters were determined using Image J processing software. STEM-EDS was employed to obtain a general chemical analysis of the samples.
Mössbauer spectroscopy: Mössbauer spectroscopy was the predominant characterization method utilized to gain understanding in the progression of oxidation of the coated and uncoated particle samples. A constant acceleration drive using a 57Co/Rh radiation source was used to obtain the 57Fe Mössbauer spectra. The experimental temperature was 293 K. Hyperfine interaction parameters were determined via least-squared fitting using Mössbauer GenFit software.
Results and Discussion
Transmission electron microscopy and energy dispersive x-ray spectroscopy
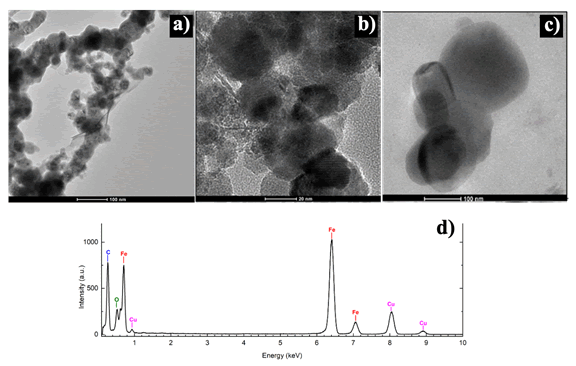
TEM was used to analyze the particle size, morphology, and distribution. TEM images and an EDS spectrum of the coated and uncoated particles are shown in Figure 2. Both coated and uncoated metallic iron nanoparticles tended to agglomerate or aggregate in either spheroid patterns or chain line structures respectively. This could be due to their magnetic dipole-dipole interactions, and to reduce their surface energy [23,24]. Another cause for the formation of chain like structures and aggregates can be attributed to drying the nanoparticles in a furnace overnight. The coated nanoparticles tended to agglomerate as larger spheroidal masses, while uncoated nanoparticles formed chain like structures.
Nanoparticle chains that formed from uncoated particles consisted of single nanoparticles ranging in diameter between 50 nm-100 nm, with an average particle size of 80 nm. More spherical particles that were coated averaged 40 nm-100 nm in diameter. A darker iron core with a brighter iron oxide shell can be seen in both the coated spherical particles and the uncoated chain like particle structures. This type of core-shell structure morphology is typical of metallic iron nanoparticles due to iron’s high reactivity to oxygen. A thin oxide layer will often passivate the highly reactive iron core’s surface [25].
The PEG surface coating can help improve colloidal stability and reduce agglomeration [26-28]. However, the optimal amount required to achieve this with these nanoparticles has not yet been determined. Such spheroid agglomerations in coated nanoparticles could be due to particles sticking together through the reaction pathway before being properly coated. Also, the PEG coating may not have been uniformly distributed on individual particles, thus causing more agglomerations to occur. A higher molecular weighted PEG could also help improve colloidal stability by providing more steric hinderances as well [29].
STEM-EDS was performed on the samples to determine chemical composition of the Fe nanoparticles. EDS peaks observed at 0.7 keV, 6.6 keV and 7.1 keV have been assigned to Fe, Lα, Kα and Kβ lines respectively. An oxygen peak at 0.5 keV was detected, which could be due to the protective oxide shell that formed on the particles. The peaks at 0.9 keV and 8.0 keV are assigned to Copper Lα and Kα lines, respectively, and the peak at 0.3 keV is attributed to carbon. Both the carbon and copper peaks are due to the carbon coated copper TEM grids that were used when performing STEM-EDS measurements (Figure 2).
Powder x-ray diffraction
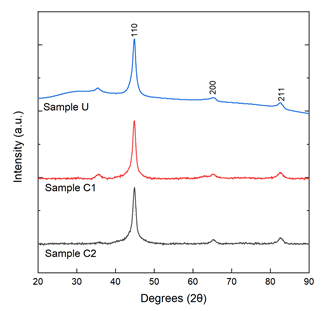
Powder x-ray diffraction results of as-made samples are shown in Figure 3. Characteristic peaks at 2θ=44.9°, 65.1° and 82.5° correspond to (110), (200), and (211) body-centered cubic crystal planes of α-Fe (JCPDS card no. 87-0722). The shoulder that is shown in sample U around the 30° mark may be due to fluorescence of the sample during the scan [30]. Some presence of FE3O4 is apparent due to the small peak shown around 2θ=35° in all samples except sample C2 [31,32]. A possible reason could be that the thin oxide shell was amorphous and did not show a peak from XRD.
Since XRD is not sensitive enough to detect various types of oxides present and possible amorphous layers surrounding the crystalline iron core of the nanoparticles, Mössbauer spectroscopy was employed to give a more detailed understanding of the iron ions’ local chemical environment throughout the various states of ambient oxidation (Figure 3).
Mössbauer spectroscopy
Mössbauer spectroscopy is an accurate characterization method used in determining oxidation components and rate of oxidation in samples. Mössbauer spectroscopy easily distinguishes valence states in Fe. Three main parameters are important in determining the components in the spectra. The first is the hyperfine field, which is from the magnetic field generated at the nucleus by interactions with electrons in magnetic materials. The second is the isomer shift, which arises from the difference in s electron density between the source and the absorber. The third is the quadrupole splitting, which is the shift in nuclear energy levels that is induced by an electric field gradient caused by nearby electrons [33-35]. Based on these three parameters, components are attributed to bulk alpha iron, amorphous iron phases, and other iron oxides that are in the core, shell or are impurities following the synthesis [36].
Sample U
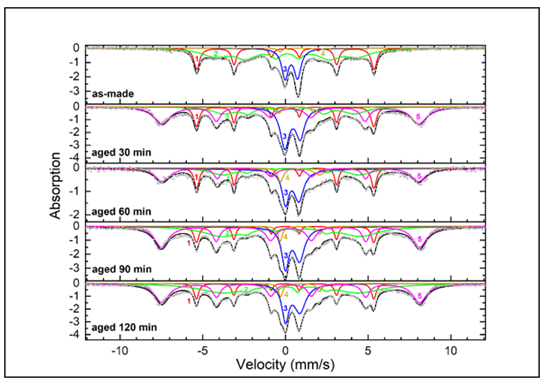
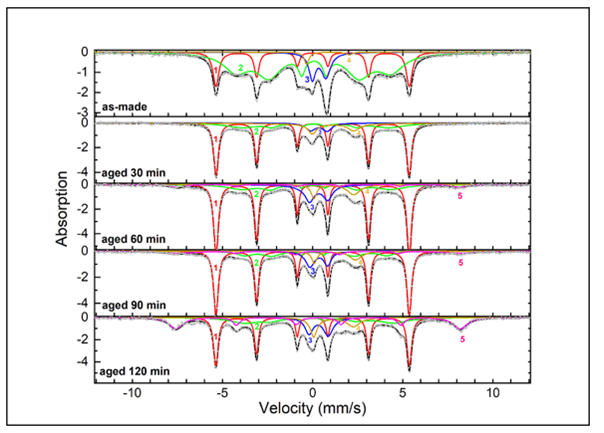
The Mössbauer spectra for sample U are shown in Figure 4, and the hyperfine parameters are shown in Table 1. For the various spectra of Sample U, the narrow sextets (component 1) with magnetic hyperfine field of 33.4 T, isomer shift 0.00 mm/s, and quadrupole splitting 0.00 mm/s are characteristic of crystalline α-Fe in the core. The interior broad sextets (component 2) with hyperfine field between 24.5 T-27.0 T, isomer shift 0.08 mm/s-0.22 mm/s, and quadrupole splitting of about 0.22 mm/s correspond to amorphous iron nanoparticles. The split doublets (component 3) with isomer shift 0.35 mm/s-0.44 mm/s and quadrupole splitting ~0.86 mm/s can be attributed to Fe3+ ions in oxide phases such as superparamagnetic γ-Fe2O3. The split doublets (component 4) with isomer shift ~0.85 mm/s and quadrupole splitting ~2.36 mm/s correspond to partially reacted/oxidized iron oxide phases that occurred during sample synthesis. Finally, the exterior broad sextets (component 5) with hyperfine field 48.1 T, isomer shift 0.33 mm/s, and quadrupole splitting -0.01 mm/s are representative of Fe3+ ions in γ-Fe2O3 in the shell of larger nanoparticles or agglomerates.
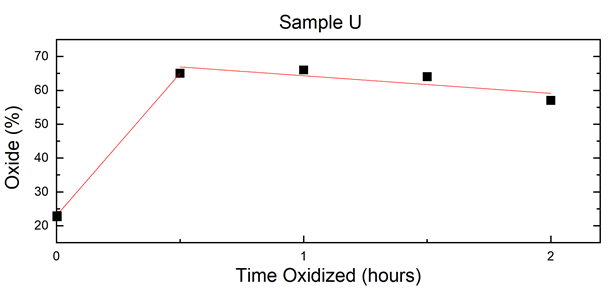
From the results shown in Table 2, a linear fit of oxide percentage over time was graphed, which is shown in Figure 5. Sample U experienced the entirety of its oxidation within the first 30-minute interval. The iron/iron oxide ratio in the as-made sample dropped from 77%/23% to 35%/65% in the 30-minute interval, and this latter ratio held relatively steady throughout the duration of the experiment (Figures 4 and 5) (Table 1).
| Sample U | Component | Bhf (T) | δ (mm/s) | ΔEQ (mm/s) | Γ (mm/s) | Relative area (%) | Attribution |
|---|---|---|---|---|---|---|---|
| as-made | 1 | 33.2 | 0 | 0 | 0.41 | 25 | α-Fe |
| 2 | 27 | 0.08 | -0.05 | 1.89 | 52 | amorphous Fe | |
| 3 | - | 0.35 | 0.76 | 0.5 | 21 | Fe3+ oxides | |
| 4 | - | 0.82 | 2.29 | 0.37 | 2 | Fe2+ impurities | |
| aged 30 min | 1 | 33.2 | -0.01 | -0.01 | 0.4 | 17 | α-Fe |
| 2 | 24.5 | 0.13 | 0.21 | 1.69 | 18 | amorphous Fe | |
| 3 | - | 0.43 | 0.93 | 0.64 | 24 | Fe3+ oxides | |
| 4 | - | 0.69 | 2.12 | 0.36 | 2 | Fe2+ impurities | |
| 5 | 48.1 | 0.32 | -0.01 | 1.17 | 39 | γ-Fe2O3 | |
| aged 60 min | 1 | 33.2 | 0 | -0.01 | 0.35 | 17 | α-Fe |
| 2 | 25.7 | 0.22 | 0.22 | 1.86 | 17 | amorphous Fe | |
| 3 | - | 0.41 | 0.82 | 0.71 | 32 | Fe3+ oxides | |
| 4 | - | 0.88 | 2.36 | 0.83 | 6 | Fe2+ impurities | |
| 5 | 48.1 | 0.33 | -0.06 | 1.08 | 28 | γ-Fe2O3 | |
| aged 90 min | 1 | 33.3 | -0.02 | -0.01 | 0.36 | 10 | α-Fe |
| 2 | 25.8 | 0.2 | 0.27 | 2.75 | 26 | amorphous Fe | |
| 3 | - | 0.42 | 0.86 | 0.73 | 28 | Fe3+ oxides | |
| 4 | - | 0.87 | 2.38 | 0.36 | 3 | Fe2+ impurities | |
| 5 | 48.4 | 0.33 | -0.03 | 1.04 | 33 | γ-Fe2O3 | |
| aged 120 min | 1 | 33.3 | -0.02 | -0.01 | 0.33 | 10 | α-Fe |
| 2 | 25.5 | 0.2 | 0.22 | 3.39 | 33 | amorphous Fe | |
| 3 | - | 0.44 | 0.88 | 0.86 | 21 | Fe3+ oxides | |
| 4 | - | 0.89 | 2,36 | 0.36 | 3 | Fe2+ impurities | |
| 5 | 48.3 | 0.33 | -0.02 | 1.03 | 33 | γ-Fe2O3 |
Table 1: Values of hyperfine parameters derived from fitting sample U uncoated iron nanoparticles prepared at room temperature in ambient conditions to test oxidation. Bhf is the hyperfine magnetic field, δ is the isomer shift, ΔEQ is the quadrupole splitting, and Γ is the linewidth (FWHM). Typical errors are ± 0.03 mm/s for Bhf, ± 0.5 mm/s for δ, ΔEQ and Γ and ± 3% for relative area.
Sample C1
Time studies were conducted to determine the rate and percentage of oxidation on the coated and uncoated samples in order to draw comparisons. The coated particles were labeled C and the uncoated particles were labeled U. For Samples C1 and U, the particles were exposed to ambient conditions in 30-minute intervals up to 120 minutes and Mössbauer spectra were obtained for each. The time series spectra of sample C1 is shown in Figure 6. The spectra consisted of 5 components, a narrow sextet (component 1, red), a broad interior sextet (component 2, green), two split doublets (component 3, blue) (component 4, yellow), and a broad exterior sextet (component 5, pink). The hyperfine parameters are shown in Table 2.
For the spectra of Sample C1, the narrow sextets (component 1) with magnetic hyperfine field of 33.2 T, isomer shift 0.00 mm/s, and quadrupole splitting 0.00 mm/s are characteristic of crystalline α-Fe in the core. The interior broad sextets (component 2) with a hyperfine field ranging from 24.4 T- 26.7 T, isomer shift between 0.06 mm/s-0.19 mm/s, and quadrupole splitting 0.17 mm/s corresponds to amorphous Fe nanoparticles. The split doublet (component 3) with an isomer shift of 0.35 mm/s and quadrupole splitting around 0.93 mm/s can be attributed to Fe3+ ions in oxide or hydroxide phases such as super paramagnetic γ-Fe2O3 or ferrihydrite. The split doublet (component 4) with an isomer shift around 0.85 mm/s and quadrupole splitting of 2.36 mm/s corresponds to partially reacted, iron oxide phases that occur during the synthesis. Finally, the exterior broad sextets (component 5) with hyperfine field 48.1 T, isomer shift 0.33 mm/s, and quadrupole splitting -0.01 mm/s are representative of Fe3+ ions in γ-Fe2O3 in the shell of larger nanoparticles or agglomerates.
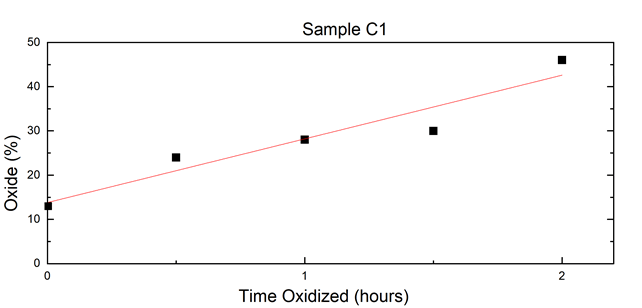
A linear fit of oxide percentage over time based on Table 2’s results is shown in Figure 7. From the Mössbauer results, sample C1’s total metallic iron and iron oxide content over the course of the time series displayed a steady progression of oxidation equal to about 14% per hour (Figures 6 and 7) (Table 2).
| Sample C1 | Component | Bhf (T) | δ (mm/s) | ΔEQ (mm/s) | Γ (mm/s) | Relative area (%) | Attribution |
|---|---|---|---|---|---|---|---|
| as-made | 1 | 33.2 | 0 | 0 | 0.38 | 22 | α-Fe |
| 2 | 26.7 | 0.06 | -0.02 | 1.67 | 65 | amorphous Fe | |
| 3 | - | 0.36 | 0.76 | 0.61 | 11 | Fe3+ oxides | |
| 4 | - | 0.85 | 2.37 | 0.37 | 2 | Fe2+ impurities | |
| aged 30 min | 1 | 33.2 | 0 | 0 | 0.31 | 54 | α-Fe |
| 2 | 25.2 | 0.12 | 0.09 | 2.21 | 22 | amorphous Fe | |
| 3 | - | 0.35 | 0.93 | 0.61 | 8 | Fe3+ oxides | |
| 4 | - | 1.14 | 2.31 | 0.8 | 16 | Fe2+ impurities | |
| aged 60 min | 1 | 33.2 | 0 | 0 | 0.3 | 55 | α-Fe |
| 2 | 25.6 | 0.12 | 0.17 | 1.06 | 17 | amorphous Fe | |
| 3 | - | 0.34 | 1.03 | 0.48 | 14 | Fe3+ oxides | |
| 4 | - | 1.18 | 2.22 | 0.82 | 9 | Fe2+ impurities | |
| 5 | 48.5 | 0.3 | -0.03 | 2.04 | 5 | γ-Fe2O3 | |
| aged 90 min | 1 | 33.3 | 0 | 0 | 0.3 | 55 | α-Fe |
| 2 | 24.4 | 0.08 | 0.17 | 1.88 | 15 | amorphous Fe | |
| 3 | - | 0.34 | 0.98 | 0.64 | 12 | Fe3+ oxides | |
| 4 | - | 1.24 | 2.29 | 0.86 | 8 | Fe2+ impurities | |
| 5 | 48.3 | 0.28 | -0.07 | 0.92 | 10 | γ-Fe2O3 | |
| aged 120 min | 1 | 33.2 | 0 | 0 | 0.3 | 36 | α-Fe |
| 2 | 25.6 | 0.19 | 0.32 | 1.86 | 18 | amorphous Fe | |
| 3 | - | 0.33 | 1.07 | 0.6 | 13 | Fe3+ oxides | |
| 4 | - | 1.16 | 2.2 | 0.85 | 11 | Fe2+ impurities | |
| 5 | 48.9 | 0.32 | -0.03 | 0.94 | 22 | γ-Fe2O3 |
Table 2: Values of hyperfine parameters derived from fitting Sample C1 coated iron nanoparticles prepared at room temperature in ambient conditions to test oxidation. Bhf is the hyperfine magnetic field, δ is the isomer shift, ΔEQ is the quadrupole splitting, and Γ is the linewidth (FWHM). Typical errors are ± 0.03 mm/s for Bhf, ± 0.5 mm/s for δ, ΔEQ and Γ and ± 3% for relative area.
When comparing the rate of oxidation results between the coated and uncoated particles, it is clear that the coated particles experienced a slower and steadier oxidation compared to the uncoated particles. The PEG coating on the particles acts as a protective layer for the particles to experience a slower oxidation over time [27,37].
Sample C2
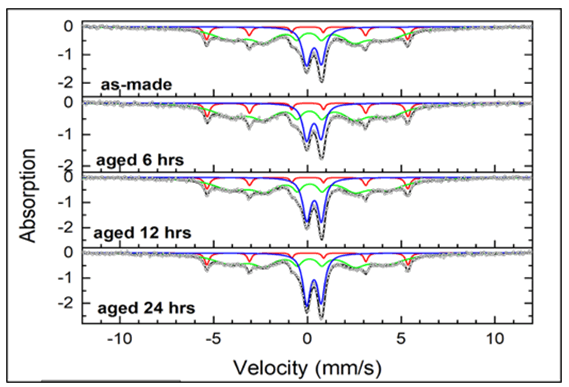
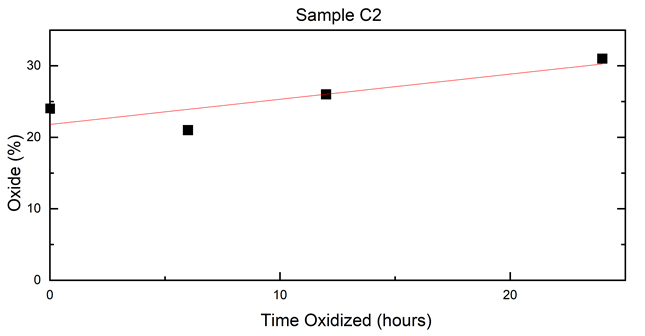
Mössbauer spectra of C2 are shown in Figure 8 and the data are summarized in Table 3. Since the previous coated sample displayed a slower progression of oxidation, another synthesis of metallic iron nanoparticles was prepared. For Sample 2, the volume of PEG 300 used was doubled from 300 µL to 600 µL. Doubling the volume of PEG in the coating solution was to allow for a better and more even coating on the nanoparticle surface to act as a protective layer. Due to the assumption that a more even coating was present on the synthesized particles, a longer oxidation time study was conducted in ambient conditions on the coated and uncoated particles consisting of as-made, 6 hours, 12 hours and 24 hours.
The time series Mössbauer spectra of Sample C2 can be seen in Figure 9. All the spectra consisted of 3 components, which included a narrow sextet (component 1, red), a broad interior sextet (component 2, green) and a split doublet (component 3, blue). The hyperfine parameters can be seen in Table 3.
For the various spectra of Sample C2, the narrow sextets (component 1) with magnetic hyperfine field of 33.2 T, isomer shift 0.00 mm/s, and quadrupole splitting 0.00 mm/s are characteristic of crystalline α-Fe in the core. The interior broad sextets (component 2) with a hyperfine field of 24.7 T, isomer shift ranging from 0.06 mm/s-0.10 mm/s, and quadrupole splitting around 0.04 mm/s correspond to amorphous iron nanoparticles. The split doublets (component 3) with isomer shift of 0.35 mm/s and quadrupole splitting around 0.77 mm/s can be attributed to Fe3+ ions in oxide phases such as super paramagnetic γ-Fe2O3.
A linear fit from Table 3 was performed to determine oxide percent over time, and is shown in Figure 7. From the results, very little change in the ratio of iron-to-iron oxides occurred, especially when compared to Sample C1’s oxidation rate. Sample C2 had an average of 0.35% /hour oxidation rate, compared to the 14% /hour shown in Sample C1. This could be due to a more even coating on the particles, or from a smaller amount of reactive iron present in the core from as-made samples compared to Sample 1 [38]. No signs of γ-Fe2O3 or FE3O4 components were apparent in the spectra over the course of the time study. A thicker amorphous layer of iron or amorphous iron oxide could be present in the sample, which would suggest why less oxidative changes occurred in Sample C2’s time study (Figures 8 and 9) (Table 3).
| Sample C2 | Component | Bhf (T) | δ (mm/s) | ΔEQ (mm/s) | Γ (mm/s) | Relative area (%) | Attribution |
|---|---|---|---|---|---|---|---|
| as-made | 1 | 33.2 | 0 | -0.01 | 0.31 | 10 | α-Fe |
| 2 | 25.7 | 0.06 | -0.05 | 2.39 | 66 | amorphous Fe | |
| 3 | - | 0.35 | 0.79 | 0.5 | 24 | Fe3+ oxides | |
| aged 6 hrs | 1 | 33.1 | 0 | 0 | 0.31 | 11 | α-Fe |
| 2 | 25.9 | 0.1 | -0.02 | 2.3 | 68 | amorphous Fe | |
| 3 | - | 0.34 | 0.76 | 0.49 | 21 | Fe3+ oxides | |
| aged 12 hrs | 1 | 33.1 | 0 | -0.01 | 0.31 | 10 | α-Fe |
| 2 | 25.7 | 0.1 | -0.04 | 2.43 | 64 | amorphous Fe | |
| 3 | - | 0.35 | 0.78 | 0.45 | 26 | Fe3+ oxides | |
| aged 24 hrs | 1 | 33.2 | 0 | -0.01 | 0.28 | 9 | α-Fe |
| 2 | 25.8 | 0.09 | -0.04 | 2.39 | 60 | amorphous Fe | |
| 3 | - | 0.35 | 0.77 | 0.47 | 31 | Fe3+ oxides |
Table 3: Values of hyperfine parameters derived from fitting sample C2 uncoated iron nanoparticles prepared at room temperature in ambient conditions to test oxidation. Bhf is the hyperfine magnetic field, δ is the isomer shift, ΔEQ is the quadrupole splitting, and Γ is the linewidth (FWHM). Typical errors are ± 0.03 mm/s for Bhf, ± 0.5 mm/s for δ, ΔEQ, and Γ and ± 3% for relative area.
Conclusion and Future Directions
In this study, coated and uncoated iron nanoparticles were synthesized and exposed to ambient conditions to test and compare oxidation rates and chemical changes. From the results, it can be concluded that coating metallic iron nanoparticles allows for a steadier and slower progression of oxidation. The coating acts as a protective layer that slows oxidation and protects the particles from ambient conditions that would otherwise oxidize completely within the first 30 minutes of exposure. Coating the particles allows for improved biocompatibility and controlled oxidation which can allow for prolonged metallic properties of iron for biomedical uses. The superior magnetic properties iron possesses compared to iron oxides would allow for overall improvement in medical imaging modalities such as MRI or MPI, since both imaging modalities rely on the magnetic properties of the materials. Due to the higher magnetic saturation properties iron possesses, improved MRI contrast or MPI signal resolution can be exhibited. In addition, since iron concentration is higher, standard administrative doses to patients could be decreased during imaging, which could allow for faster imaging time and improve patient comfort.
In addition, a larger volume of PEG 300 used in solution led to improved coatings on the particles. However, despite the addition of PEG, agglomerations of particles were still observed. This could be due to the low molecular weight of the PEG used, which was insufficient in providing enough steric hinderances to prevent agglomerations. The particles could have also been unevenly coated. Additional studies are needed to determine the optimal molecular weight of PEG in order to provide a sufficient protective layer to allow for optimized oxidation rate and better modispersed particles.
Future studies of this research will involve in vitro cell studies and small animal models to further investigate oxidation rate and circulation time. Understanding the oxidation rate using in vivo models is imperative to properly determine time needed for both circulation and obtaining higher quality medical images while optimizing the magnetic properties of iron. In addition, further experiments involving the usage of higher molecular weights of PEG will be studied to ensure that steric hindrances on coated particles are more apparent.
Author Contributions
A.G.W. conceptualization, investigation, writing, review, and editing. AWE conceptualization and resources. JAJ supervision, review and editing. LL and CEJ review and editing. This work was performed by AWE in partial fulfillment for the degree of PH.D. at the University of Tennessee. All authors have read and agreed to the final version of the manuscript.
Data Availability Statement
The data used to support the findings of this study are included within the article.
Funding
This research received no external funding.
Conflicts of Interest
The authors declare no conflict of interest
References
- Patra JK, Das G, Fraceto LF, Campos EVR, Rodriguez-Torris MDP, et al. (2018) Nano based drug delivery systems: Recent developments and future prospects. J Nanobiotechnology 16: 71. [Crossref], [Google Scholar], [Indexed]
- Guerra FD, Attia MF, Whitehead DC, Alexis F (2018) Nanotechnology for environmental remediation: Mateirals and applications. Molecules 23: 1760. [Crossref], [Google Scholar], [Indexed]
- Yeo D, Wiraja C, Chuah YJ, Gao Y, Xu C (2015) A nanoparticle-based sensor platform for cell tracking and status/function assessment. Nature 14768. [Crossref], [Google Scholar], [Indexed]
- Poizot P, Laruelle S, Grugeon S, Dupont L, Tarascon JM (2000) Nano-sized transition-metal oxides as negative-electrode materials for lithium-ion batteries. Nature 407: 496-499. [Crossref], [Google Scholar], [Indexed]
- Williams HM (2017) The application of magnetic nanoparticles in the treatment and monitoring of cancer and infectious diseases. Biosci Horiz 10. [Crossref], [Google Scholar]
- Blanco-Andujar C, Walter A, Cotin G, Bordeianu C, Mertz D, et al. (2016) Design of iron oxide-based nanoparticles for MRI and magnetic hyperthermia. Nanomedicine 11:14. [Crossref], [Google Scholar], [Indexed]
- Goodwill PW, Conolly SM (2011) Multidimensional x-space magnetic particle imaging. IEEE Tran Med Imaging 30: 1581-1590. [Crossref], [Google Scholar], [Indexed]
- Weizenecker J, Borgert J, Gleich B (2007) A simulation study on the resolution and sensitivity of magnetic particle imaging. Phys Med Biol 52: 6363. [Crossref], [Google Scholar], [Indexed]
- Chandrasekharan P, Tay ZW, Hensley D, Zhou XY, Fung BK, et al. (2020) Using magnetic particle imaging systems to localize and guide magnetic hyperthermia treatment: Tracers, hardware, and future medical applications. Theranostics 10: 2965-2981. [Crossref], [Google Scholar], [Indexed]
- Borgert J, Schmidt JD, Schmale I, Rahmer J, Bontus C, et al. (2012) Fundamentals and applications of magnetic particle imaging. J Cardiovasc Comput Tomogr 6: 149-153. [Crossref], [Google Scholar], [Indexed]
- Hadjipanayis CG, Bonder MJ, Balakrishnan S, Wang X, Mao H, t al. (2008) Metallic iron nanoparticles for MRI contrast enhancement and local hyperthermia. Small 4: 1925-1929. [Crossref], [Google Scholar], [Indexed]
- Cheong S, Ferguson P, Feindel KW, Hermans IF, Callaghan PT, et al. (2011) Simple synthesis and functionalization of iron nanoparticles for magnetic resonance imaging. Angew Chem Int Edi Engl 50: 4206-9 [Crossref], [Google Scholar], [Indexed]
- Makela AV, Gaudet JM, Schott MA, Sehl OC, Contag CH, et al. (2020) Magnetic particle imaging of macrophages associated with cancer: Filling the voids left by iron-based magnetic resonance imaging. Mol Imaging Biol 22: 958-968. [Crossref], [Google Scholar], [Indexed]
- Graeser M, Knopp T, Szwargulski P, Friedrich T, Gladiss AV, et al. (2017) Towards picogram detection of superparamgnetic iron-oxide particles using a fadiometric recieve coil. Sci Rep 7: 6872. [Crossref], [Google Scholar], [Indexed]
- Gloag L, Mehdipour M, Ulanova M, Mariandry K, Nichol MA, et al. (2020) Zero valent iron core-iron oxide shell nanoparticles as small magnetic particle imaging tracers. RSC 56. [Crossref], [Google Scholar]
- Markides H, Rotherham M, El Haj AJ (2012) Biocompatibility and toxicity of magnetic nanoparticles in regenerative medicine. J Nanomater 2012: 614094. [Crossref], [Google Scholar]
- Krajewski M, Brozka K, Lin WS, Lin HM, Tokarczyk M,et al. (2016) High temperature oxidation of iron-iron oxide core-shell nanowires composed of iron nanoparticles. RSC. [Crossref], [Google Scholar]
- Paunovic J, Vucevic D, Radosavljevic T, Mandić-Rajčević S, Pantic I (2019) Iron-based nanoparticles and their potential toxicity: Focus on oxidative stress and apoptosis. Chem Biol Interact 25: 108935. [Crossref], [Google Scholar], [Indexed]
- Tai MF, Lai CW, Hamid SBA (2016) Facile synthesis polyethylene glycol coated magnetite nanoparticles for high colloidal stability. J Nanomater 2016. [Crossref], [Google Scholar]
- Nano based drug delivery systems: Recent developments and future prospects
- Gradinaru LM, Mandru MB, Drobota M, Aflori M, Butnaru M, et al. (2021) Composite materials based on iron oxide nanoparticles and polyurethane for improveing the quality of MRI. Polymers 13: 4316. [Crossref], [Google Scholar], [Indexed]
- Granitzer P, Rumpf K (2011) Magnetic nanoparticles embedded in a silicon matrix. Materials 4: 908-928. [Crossref], [Google Scholar], [Indexed]
- Wu W, He Q, Jiang C (2008) Magnetic iron oxide nanoparticles: Synthesis and surface functionalization strategies. Nanoscale Res Let 3: 397. [Crossref], [Google Scholar]
- Nurdin I, Ridwan, Satriananda (2016) The effect of pH and time on the stability of superparamagnetic maghemite nanoparticle suspensions. EDP Sciences 39. [Crossref], [Google Scholar]
- Sun YP, Li XQ, Cao J, Zhang WX, Wang HP (2006) Characterization of zero-valent iron nanoparticles. Adv Colloid Interface Sci 120: 47-56. [Crossref], [Google Scholar], [Indexed]
- Reddy LH, Arias JL, Nicolas J, Couvreur P (2012) Magnetic nanoparticles: Design and characterization, toxicity and biocompatibility, pharmaceutical and biomedical applications. Chemical Reviews 112: 5818-78. [Crossref], [Google Scholar], [Indexed]
- Karaagac O, Köçkar H (2022) Improvement of the saturation magnetization of PEG coated superparamagnetic iron oxide nanoparticles. J Magn Magn 551: 169140. [Crossref], [Google Scholar]
- Antarnusa G, Suharyadi E (2020) A synthesis of Polyethylene Glycol (PEG)-coated magnetite FE3O4 nanoparticles and their characteristics for enhancement of biosensor. Mater Res Express 7: 056103. [Crossref], [Google Scholar]
- Suk JS, Xu Q, Kim M, Hanes J, Ensign LM (2016) PEGylation as a strategy for improving nanoparticle-based drug and gene delivery. Adv Drug Deliv Rev 99: 28-51. [Crossref], [Google Scholar], [Indexed]
- Mos YM, Vermeulen AC, Buisman CJN, Weijma J (2018) X-ray diffraction of iron containing samples: The importance of a suitable configuration. Geomicrobiol J 6: 511-517. [Crossref], [Google Scholar]
- Peng S, Wang C, Xie J, Sun S (2006) Synthesis and stabilization of monodisperse Fe nanoparticles. J Am Chem Soc 128: 10676-10677. [Crossref], [Google Scholar], [Indexed]
- Du Y, Pei M, He Y, Yu F, Guo W, et al. (2014) Preparation, characterization and application of magnetic FE3O4-CS for the adsorption of orange I from aqueous solutions. PLOS One 9: e108647. [Crossref], [Google Scholar], [Indexed]
- Dyar MD. Mössbauer spectrosocpy.
- McCammon CA (2000) Insights into phase transformations from Mössbauer spectroscopy. Rev Mineral and Geochem 39: 241-264. [Crossref], [Google Scholar]
- Mørup S (1990) Mössbauer effect in small particles. Hyperfine Interact 60: 959-973. [Crossref], [Google Scholar]
- Petala E, Dimos K, Douvalis A, Bakas T, Tucek J, et al. (2013) Nanoscale zero-valent iron supported on mesoporous silica: Characterization of reactivity for Cr(VI) removal from aeuqous solution. J Hazard Mater 261: 295-306. [Crossref], [Google Scholar], [Indexed]
- Cartwright A, Jackson K, Morgan C, Anderson A, Britt DW (2020) A review of metal and metal-oxide nanoparticle coating tehcnologies to inhibit agglomeration and increase bioactivity for agricultural applications. Agronomy 10: 1018. [Crossref], [Google Scholar]
- Issa B, Obaidat IM, Albiss BA, Haik Y (2013) Magnetic nanoparticles: Surface effects and properties related to biomedicine applications. Int J Mol Sci 14: 21266-212305. [Crossref], [Google Scholar], [Indexed]
Open Access Journals
- Aquaculture & Veterinary Science
- Chemistry & Chemical Sciences
- Clinical Sciences
- Engineering
- General Science
- Genetics & Molecular Biology
- Health Care & Nursing
- Immunology & Microbiology
- Materials Science
- Mathematics & Physics
- Medical Sciences
- Neurology & Psychiatry
- Oncology & Cancer Science
- Pharmaceutical Sciences
