Study on Antheraea perny Silk Fibroin Nanoparticles Carried Insulin
Xiang Xue, Hua Fu and Shenzhou Lu
DOI10.21767/2471-9838.100020
Xiang Xue, Hua Fu and Shenzhou Lu*
National Engineering Laboratory for Modern Silk, College of Textile and Clothing Engineering, Soochow University, Suzhou 215123, P.R. China
- *Corresponding Author:
- Shenzhou Lu
National Engineering Laboratory for Modern Silk
College of Textile and Clothing Engineering
Soochow University, Suzhou 215123, P.R. China
Tel: +86-512-6706-1152
E-mail: lushenzhou@suda.edu.cn
Received Date: November 10, 2017 Accepted Date: March 28, 2017 Published Date:March 31, 2017
Citation: Xue X, Fu H , Lu S. Study on Antheraea perny Silk Fibroin Nanoparticles Carried Insulin. Nano Res Appl. 2017, 3:1.
Abstract
Chinese oak tasar Antheraea pernyi silk fibroin nanoparticles are a promising biomaterial for drug delivery because of its good properties, such as biodegradability and biocompatibility. In recent decades, self-assembling nanoparticles derived from Antheraea perny silk fibroin have risen too much interest in application of drug delivery. In this paper, the Ca2+ in calcium gluconate induced self-assembling nanoparticles. It was fabricated by blending aqueous Antheraea perny silk fibroin solution, calcium ion and insulin in a proper mixing ratio. The structure of the silk nanoparticles carried insulin was characterized by X-ray diffraction, FTIR and DTA. The size and the morphology of silk nanoparticles were tested using scanning electron microscope and particulate size description analysers. The drug content, covering rate and in vitro cumulative release of silk nanoparticles were also determinate. The results demonstrated that the Ca2+ induced selfassembling nanoparticles hold the particle size of 200~500 nm. The phenomenon of the sustained release is comparatively obvious in the silk nanoparticles. To summarize, this research will open up a new experimental basis on the usage of macromolecular drug, insulin which can properly meet the satisfaction of the patients desired for sustained-release insulin.
https://tipobette.com https://vdcasinoyagiris.com https://venusbetting.com https://sahabetting.com https://sekabete.com https://sahabete-giris.com https://onwine-giris.com https://matadorbet-giris.com https://casibomkayit.com https://casibomba.com https://casiboms.com https://casinoplusa.org https://casibomlink.com https://yenicasibom.com https://jojobetegiris.com https://jojoguncel.com https://jojobetyeni.com https://girisgrandbetting.com https://pashabetegiris.com https://grandbettingyeni.com
Keywords
Antheraea perny silk fibroin; Nanoparticles; Drug delivery; Insulin
Abbreviations
INS: Insulin; ASF: Antheraea perny Silk Fibroin
Introduction
The gradual improvement of the living standard of human beings, the incidence of diabetes is increasing day by day. Although diabetes does not have the obvious symptoms of cardiovascular disease, the horror of AIDS and the intense rapid of cancer. Diabetes continues to erode human body. Diabetes acts an important role quietly among several major "killers" who endanger human life. And diabetes becomes the third largest diseases killer after cardiovascular diseases and cancer in threating to human health.
Silk fibroin has polypeptide chain segments, which presents random curl in dilute solution, α-helical structures in concentrated solution and water-insoluble β-hairpin formed while silkworms spin silk [1,2]. In the medical field, silk fibroin has good biocompatibility, biodegradability, and non-toxicity so that it can become a promising application of drug delivery medical materials.
Because of tryptophan, tyrosine and other amino acids, silk fibroin has a good antibacterial activity against mound, Staphylococcus aureus and Escherichia coli as well as the study on the skin sensitization in guinea pigs proves silk fibroin biocompatibility [3]. Historically, drug delivery systems are usually for oral or based injectable. However, medicines such as proteins or nucleic acids are considered as unsuitable for traditional treatment will face the dilemma. New technology is required to use in these new drugs to reduce side effects of these drugs, to optimize the efficacy of the drugs and enhance patient compliance. Recently the usage of nanotechnology has achieved the action to control release of new drugs. The nanotechnology can be applied in a wide range of small molecules, proteins or genetic drug delivery [4-9]. Drug release material needs to have excellent biocompatibility, biodegradability, low toxicity and appropriate mechanical properties. Chinese oak tasar Antheraea perny silk fibroin (ASF) is a natural polymer material, and having the ability to self-assemble, excellent mechanical properties, processing flexibility, good biodegradability and biocompatibility because of its unique structure and properties of silk fibroin [10].
Materials and Methods
Materials
Anhydrous sodium carbonate (AR, China Shanghai Reagent Factory), Chinese oak tasar Antheraea perny silk fibroin (AR, ShangHai jin Lu Trade Co., Ltd.), ammonium thiocyanate (AR, Chengdu Kelong Chemical reagent factory), a saturated solution of ammonium thiocyanate (lithium prepared by reacting lithium hydroxide and thiocyanate), dialysis bag: 14 KD, sodium chloride, calcium gluconate (Aladdin reagent), Tris-HCl (Bioengineering (Shanghai) Co., Ltd.), fluorescein-I (Shanghai J&K chemical technology Co., Ltd.), bovine insulin (argon, krypton, xenon Suzhou Co., Ltd.).
Preparation of regenerated fibroin protein solution
At 98°C~100°C environment for 30 min, silk fiber was degummed by treating three times to extract sericin proteins and wax with an aqueous solution containing 5 g/L Na2CO3 and 0.0625 g/L sodium dodecyl sulfate (SDS), bathing ratio 1:50, drying at 60°C. The degummed fiber was dissolved in a saturated solution of LiSCN at 50°C ± 2°C for 60 min, bathing ratio of 1:10. Then the solution was dialyzed in cellulose tube (14 KDa) against for distilled water for 4 d. The final concentration of aqueous solution was approximately 25 mg/mL then was placed in 4°C [11].
Insulin protein grafting with FITC
Insulin (INS) was dissolved in a concentration of 0.1 M carbonate buffer (0.2 mmol/l EDTA, to prevent aggregation of insulin) in a potency of 20 mg/mL, in pH 8.5. The FITC was dissolved in DMSO (dimethyl sulfoxide) in a ratio of 5 mg/mL. Then FITC solution putted into insulin solution (FITC-INS solution), according to the number of molar ratio of 3:1 (volume ratio of 12/1), in dark magnetic stirrer for 12 h. After FITC-INS solution was removed into cellulose tube (14 KDa) in deionized water dialysis for 4 d. And the entire process performed in the dark. The final solution was frozen in -80°C and placed into a freeze dryer to dry to obtain insulin protein/FITC. Insulin protein/FITC was placed in 4°C refrigerator spare [12].
Insulin loading in ASF nanoparticles
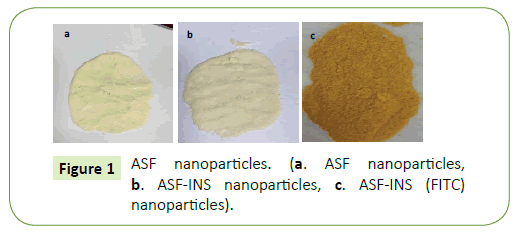
Insulin or Insulin Protein/FITC was dissolved in Tris-HCl standby solution. Silk fibroin solution, at a concentration of 20 mg/mL was mixed with the concentration of 4mM calcium gluconate in a volume ratio of 1:1. Then the same volume of drug solution added to the mixed solution. Finally, the mixture was placed in water bath at 37°C for 40 min to get Antheraea perny silk fibroin nanoparticles carried insulin (ASF-INS nanoparticles) solution. The resulting particles were centrifuged at 13000 r/min for 10 min. Subsequently, nanoparticles were washed repeatedly with deionized water to remove un-encapsulated drugs and calcium gluconate to obtain a solid pharmaceutical carrier fibroin nanoparticles (ASF-INS nanoparticles or ASF-INS(FITC) nanoparticles) sample by freeze-dried. Finally, putting them in 4°C to preserve.
Morphology of drug-loaded ASF nanoparticles
The morphology of pure ASF nanoparticles and drug-loaded ASF nanoparticles was examined by via scanning electron microscopy (SEM, Hitachi S-4700, Japan) at an accelerating voltage of 15 kV. ASF nanoparticles were distributed in water by ultra-sonication, plated directly on a silicon plate and dried by vacuum later. The samples were coated gold sputter to prevent charging during SEM scanning. The size range and deviation of particles were examined by HPP 5001 laser diffraction scattering particle size analyzer (Malvern, UK).
Drug loading in ASF nanoparticles
Drawing standard curve: INS is measured by fluorescence spectrophotometer. Due to the determination, INS and ASF have the same highest absorption of UV absorbance at λ=267 nm. In order to avoiding these experimental error, INS are labelled fluorescent. In Tris-HCl buffer, the excitation wavelength was seat at 495 nm. The detection wavelength range was (505~650) nm and the slit width was 2 nm. Insulin protein/FITC was concentrated and the photometric values were linear regression.
ASF standard curve equation: y = 1.69133x + 0.01042 R2 = 0.99991
Insulin protein/FITC standard curve equation: y = 25.4619x + 0.2569 R2 = 0.99967
Drug loading in ASF nanoparticles: Quality ratios of insulin protein/FITC with ASF are respective to 1:100, 2:100, 4:100, 6:100, 8:100, 10:100, 12:100, 14:100 and 16:100. Specific methods are as follows: According to the ratios above insulin protein/FITC with ASF, respectively, different quality of insulin protein/FITC was dissolved in corresponding solution. Then the final solution contains insulin protein/FITC solution, 20 mg/ mL fibroin solution and 4 mM calcium gluconate solution in volume ratio of 2:1:1. The mixture is placed in bath water at 37°C for 40 min. After removing from water bath, the mixture centrifuged at 13,000 r/min for 10 min. The supernatant diluted in a certain multiple was measured by steady-state fluorescence spectra of type FLS920 values, according to the standard curve, to obtain the concentration of the drug in the supernatant to calculate microspheres embedding ratio and the drug content. The precipitate was washed repeatedly with deionized water to remove un-encapsulated drugs and calcium gluconate to obtain solid fibroin microspheres samples by freeze-dried. The nanoparticles were persevered at 4°C. Standard calibration curves for the model drugs were used for drug quantification. A control group of samples containing 10 mL water mixed with the model drug solution was prepared for each experiment. Drug concentrations of the control and sample supernatants were used to calculate the amount of drug incorporated in the silk particles. Drug loading and encapsulation efficiency were determined using equations (1) and (2), respectively:
 (1)
(1)
 (2)
(2)
Release of drugs from ASF nanoparticles
Ten milligrams of the drug-loaded ASF particles were subsequently re-dispersed in 10 mL Tril-HCl buffer in pH values of 5.2, 7.4 and 8.0 at 37°C to monitor the pH-dependent release. The suspensions were sampled at pre-determined time intervals of 0.25, 0.5, 1, 2, 3, 4, 5, 6, 7, 8, 9, 10, 12, 14, 16 and 19 days. Next, the solutions were centrifuged at 12,000 rpm for 10 min to collect the solvent, and the nanoparticles were placed in fresh buffer solution. The equal free INS were dispersed in Tril-HCl buffer as the control. The percentage of cumulative release of insulin protein/FITC (%w/w) was measured using a FLS920 type steady-state fluorescence spectroscopy. The optical path length of the quartz cuvette is 1 cm. The experiment was repeated three times. The cumulative release rate was calculated using Equation (3).
 (3)
(3)
Structure of ASF nanoparticles
The pure ASF and drug-loaded ASF nanoparticles were frozen at -80°C and subsequently freeze-dried for X-ray diffraction (XRD) analysis. XRD analysis was conducted on an X ‘PERT-PRO MPD Diffractometer (Panalytical Co., Holland) with a Cu-Kα radiation source. The scanning speed was 2°/min. The X-ray source was operated at a 30 kV voltage and 20 mA current. XRD patterns were recorded in the 2θ region from 5° to 45°.
The FTIR spectra were obtained using 5700 FTIR in the spectral region of 800 cm-1 to 1800 cm-1. Respectively, freeze-dried ASFINS nanoparticles (drug loading rate of 3.5%), ASF nanoparticles, a physical mixture of INS with ASF nanoparticles (3.5% weight of INS) and INS all mixed with KBr and then pressed into thin discs to be placed in the optical path directly to obtain infrared spectra of 800 cm-1 to 1800 cm-1.
Thermal analysis
Studying crystal state and stability of the drug distribution in fibroin nanoparticles uses differential thermal analysis (Differential Thermal Analysis, DTA) with five milligrams of the ASF-INS nanoparticles (drug loading rate of 3.5%), ASF nanoparticles, a physical mixture of INS with ASF nanoparticles (3.5% weight of INS) and INS respectively. Test conditions: DTA analysis is in a nitrogen stream, under the range of 35°C~400°C, with 10°C/min heating rate.
Results and Discussion
Embedding ratio and the drug content
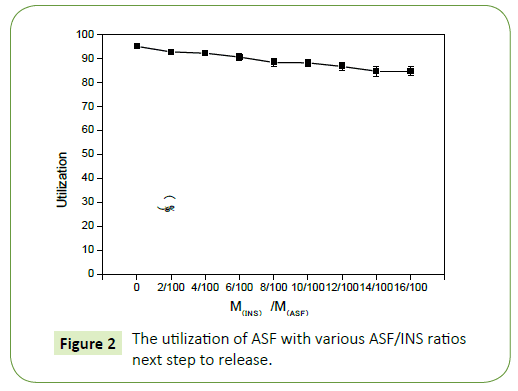
As shown in the Figure 1 the utilization ratio of ASF in ASF-INS nanoparticles changed linearly with the mass ratio of INS to ASF. When it is fixed the concentration of silk fibroin protein at 20 mg/ mL, it is seen that the utilization of ASF has a gradual downward trend from 98% to 88% with the increasing amount of INS. But the overall utilization of ASF remained at about 90% above. It proved ASF has been fully utilized and ASF will be an excellent material as a coating drug material.
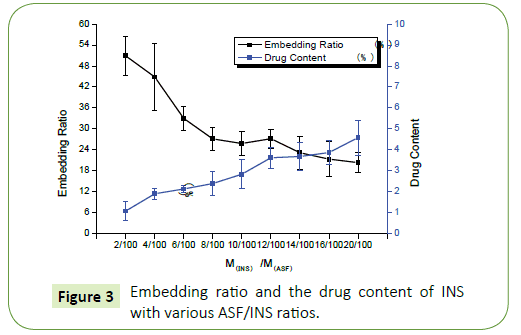
Figure 2 shows that the concentration of INS increases while embedding ratio of INS declines. When the rate of INS with ASF reaches is 12/100 (M(INS): M(ASF)=12:100), Embedding ratio and drug content have good optimization of the comprehensive costeffective ratio. So that, choosing this proportion goes on the next step to release (Figure 3).
Morphological analysis of ASF nanoparticles/ ASF-INS nanoparticles
The sizes and deviation range of ASF nanoparticles (Figure 4a)/ ASF-INS (Figure 4b) nanoparticles are measured by HPP 5001 laser diffraction scattering particle size analyzer (Malvern, UK). As it can be seen in Figure 3, ASF nanoparticles and ASF-INS nanoparticles sizes range is between (200~400) nm. The average diameter of particles is about 300 nm with good dispensability.
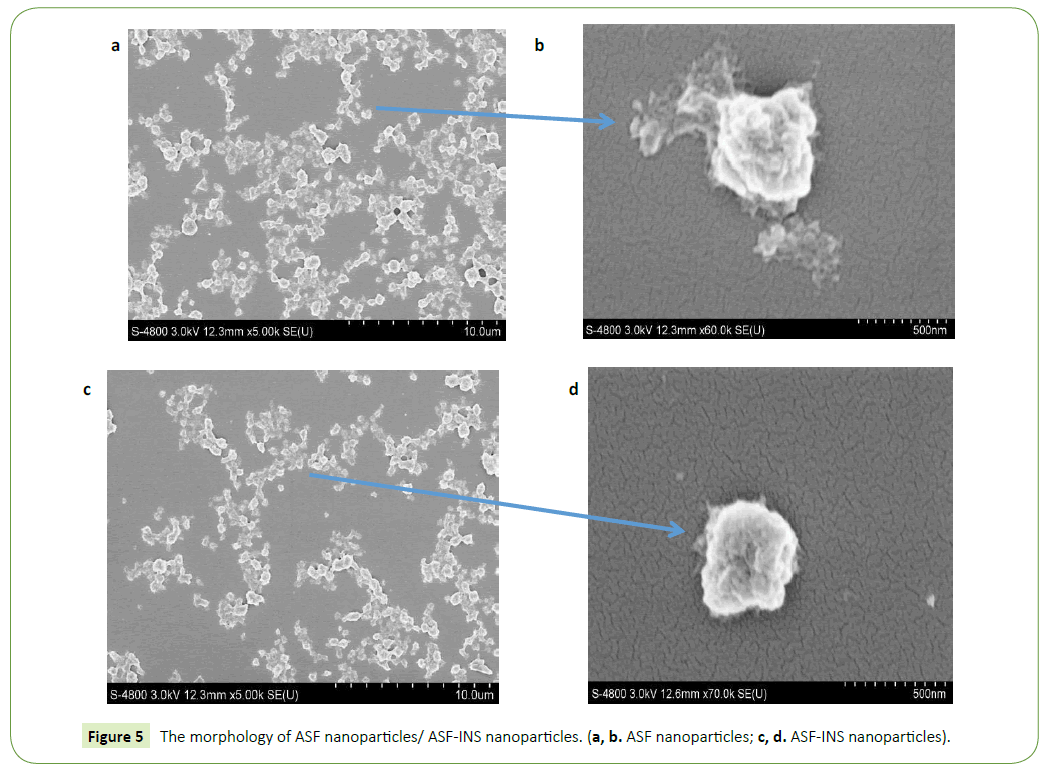
The nanoparticles of ASF nanoparticles/ASF-INS nanoparticles were observed by S-4700 scanning electron microscope (SEM, Hitachi Company). Figure 4 is described that the nanoparticles are showing the size of uniform particle size in about 300 nm, regardless of ASF nanoparticles (Figures 5a and 5b) /ASF-INS nanoparticles (Figures 5c and 5d) which in line with the sizes measured by HPP 5001 laser diffraction scattering particle size analyzer. When the nanoparticles are enlarged to about sixty thousand times, the surface of the microspheres can be seen rough, uneven. This structure can increase the area of cell attachment, which would provide good conditions for the culture of cell in future.
Structure analysis of Nano drug-loaded particles
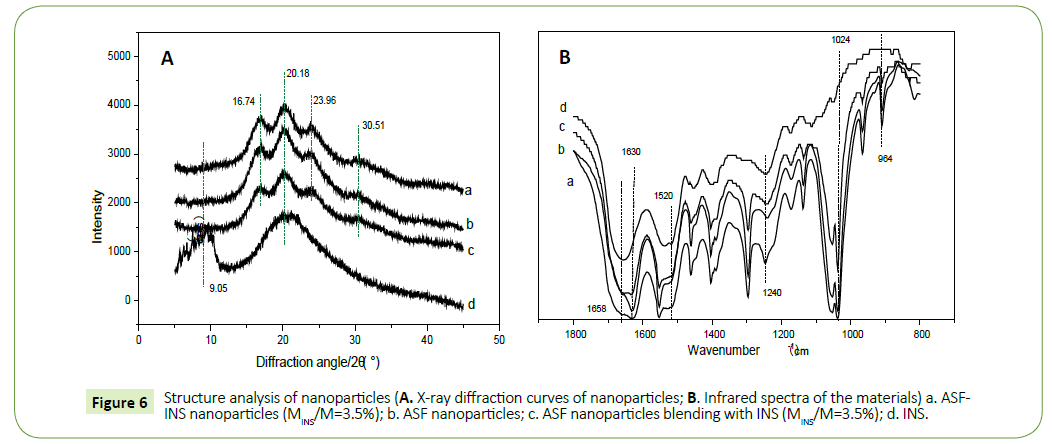
X-ray diffraction curve: X-ray diffraction curves were collected at different materials (Figure 6a). The 2θ mainly peaks at 16.7°, 20.20°, 24.90°and 30.9° nearby, corresponding to characteristic of the β-sheet. The mainly peaks represent α-helical crystalline structure close to 11.95°, 24.02° [13-15]. The main characteristics of silk fibroin solution conformation is α-helix and random coil structure [16,17]. And as we can be seen from Figure 6a, after fibroin microspheres formed by self-assembly, characteristic peaks attributed to α-helical structure disappeared, while it appeared more intense diffraction peak at 20.18°, moderateintensity diffraction peaks at 16.74° and 23.96° and a weak diffraction peak at 30.51°. It descripted that fibroin solution forms fibroin microspheres self-assembled, aggregation structure material changed to the β-sheet structure. Figure 6a (ASF-INS nanoparticles, 3.5%) was compared with Figure 6b (ASF nanoparticles freeze-dried samples) to find that they had the same peaks represented the same structure. The structure of the pure silk fibroin microspheres was consistent with of insulin, insulin tussah described self-assembled structure does not affect the nanoparticles. And diffraction peaks of b (ASF nanoparticles freeze-dried sample) and c (a physical mixture of INS with ASF nanoparticles (3.5% weight of INS) were compared with diffraction peaks of d (pure insulin) relatively large difference, indicating that pure insulin and insulin microspheres contained different structures, demonstrating good compatibility between insulin and fibroin.
Infrared spectroscopy: Since pure fibroin proteins exist mainly α-helix structure and random coil structure. The drawings (Figure 6b) from a (ASF-INS nanoparticles, 3.5%), b (ASF nanoparticles freeze-dried samples) and c (a physical mixture of INS with ASF nanoparticles (3.5% weight of INS)) can be seen strong absorption peak at 1630 cm-1 and 1520 cm-1, moderate absorption peaks at 1240 cm-1 and 964 cm-1. Those peaks belong to β-sheet structure characteristic [18,19]. The aggregation structure of ASF by selfassemble into microspheres collapsed to the β-structural. This is consistent with the results of XRD.
Thermal analysis
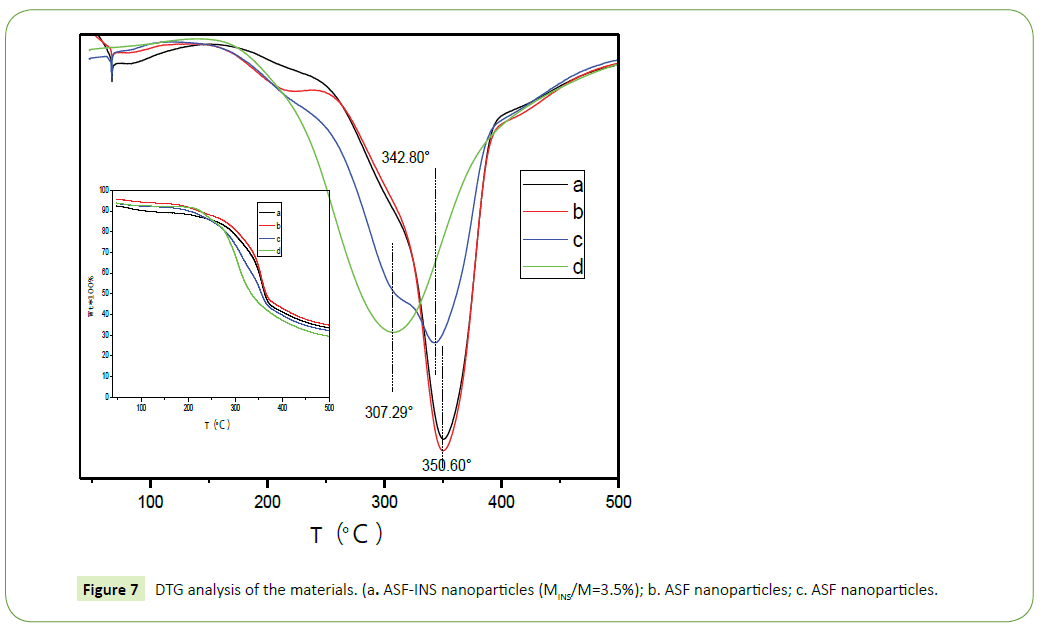
Figure 7 is DTG diagram derived from TG diagram. As it can be seen from the figure, with the increasing temperature, the quality of the materials decreased. The speed of reducing is rapid firstly and gentle then, between 250°C~400°C fastest. In Figure 7, d (pure insulin) obvious weight loss at 307.29°C, which is due to partial rupture between the molecule and a molecular chain of insulin breaking force. In Figure 7, a (ASF-INS nanoparticles, 3.5%) and b (ASF nanoparticles freeze-dried samples) apparent loss of focus at 350.60°C, which is the molecular chain of fibroin protein between local faulting and fracture caused by intermolecular forces [19,20] and the loss weight of c (a physical mixture of INS with ASF nanoparticles (3.5% weight of INS)) happened in the temperature between 307.29°C and 342.80°C, which shifts to lower significantly comparing to b (ASF nanoparticles freezedried samples). Explained that ASF-INS nanoparticles formed assembly having good stability and very compact structure is formed between insulin and silk fibroin.
The release of ASF-INS nanoparticles in vitro
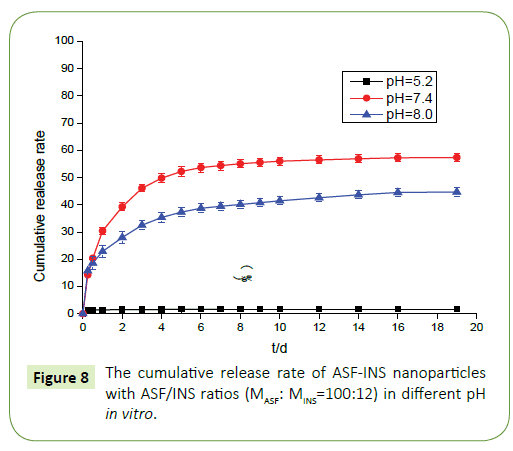
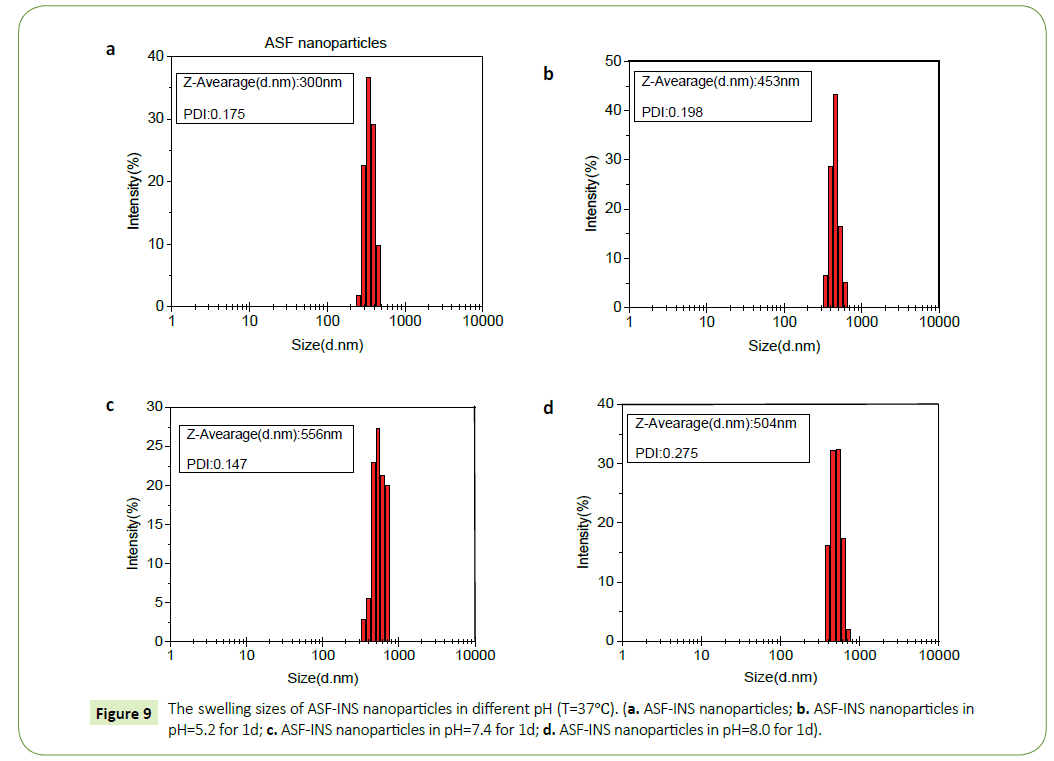
From the Figure 8 we can observe that ASF-INS nanoparticles can reach sustained obviously. The cumulative release rate of ASF-INS nanoparticles increased gradually as time goes by, while the release rate decreased. When it reached the sixth day, the release trended in gently. The choice of the pH is greatly important. In a neutral environment (pH=7.4), the cumulative release percentage of ASF-INS nanoparticles is more than 50%. While under acidic condition(pH=5.2), it is almost no insulin release. At pH=8.0, the total release of the nanoparticles will be less than in a neutral environment up to 40%. Aim to solve the phenomenon, the nanoparticles were incubated in different pH environments, and the nanoparticles were removed after a period. ASF-INS nanoparticles dry samples were placed in different pH environments, and the results showed that their swells were very different (Figures 9a-9d). The size of ASF-INS nanoparticles ranges from 200 nm to 400 nm, and the average size is maintained at 300 nm with good dispersibility (Figure 9a). And they were placed in different environments having different swelling. The diameter of the nanoparticles was about 300 nm~600 nm and the average diameter was about 450 nm in pH=5.2 (Figure 9b). Insulin is a macromolecule protein drug, which has good biocompatibility with Antheraea perny silk fibroin and is not easy to be released from ASF nanospheres. Because the microspheres are very small under acidic conditions resulting in a slow release of INS from ASF-INS nanoparticles. The diameter of the nanoparticles was about 300 nm~700 nm and the average diameter was about 550 nm in pH=7.4, which resulted in the rapid release of INS from ASF-INS nanoparticles. After 6 days of release, the release rate gradually increased from the near-straight line to became stable (Figure 9c). The size of the nanoparticles was about (300~600) nm at pH=8.0 for 1d, the strongest particle size was at (400~500) nm and the average diameter was maintained at 500 nm. So that the amount release of INS in pH=8.0 is between the two above.
Conclusion
The particle size of nanoparticles studied in this experiment is between (200~400) nm and the average diameter of particles is 300 nm having dispersion coefficient and good uniformity. When it is MINS/MASF=12/100, embedding ratio is up to 28% and the drug content is 3.5%, which reaches good optimization of the comprehensive cost-effective ratio. In different environments, the release has greater rate gap owing to the unequal swelling conditions of ASF-INS nanoparticles. Under neutral conditions, it has faster release rate to release more than 50% after six days. Whether it will have the same influence for the all macromolecules or small molecule drugs, it will go on the further study. After some experiments about characterizing and testing the stability, it shows that INS has a good combination with ASF in ASF-INS nanoparticles by self-assembly. And ASF will be a promise material as a drug carrier.
References
- Asakura T, Demura M, Ogawa H (1991) NMR imaging of diffusion of small organic molecules in silk fibroin gel[J]. Macromolecules 24: 620-622.
- Yeo JH, Lee KG, Kweon HY, Woo SO, Han SM, et al. (2004) Cognitive ability enhancement effects in rats by B. mori fibroin enzymatic hydrolysate. Korean J Sericult Sci 46: 23-27.
- Olivier A, Grobler SR, Osman Y (2012) Cytotoxicity of seven recent dentine bonding agents on mouse 3T3 fibroblast cells. Open J Stomatol 2: 244-250.
- Moghimi SM, Hunter AC, Murray JC (2001) Long-circulating and target-specific nanoparticles: theory to practice. Pharmacol Rev 53: 283-318.
- Avadi MR, Sadeghi AM, Mohammadpour N (2009) Preparation and characterization of insulin nanoparticles using chitosan and Arabic gum with ionic gelation method. Nanomedicine 6: 58-63.
- Hosseinzadeh H, Atyabi F, Dinarvand R (2012) Chitosan-Pluronic nanoparticles as oral delivery of anticancer gemcitabine: preparation and in vitro study. Int J Nanomedicine 7: 1851-1863.
- Tahamtan A, Tabarraei A, Moradi A (2015) Chitosan nanoparticles as a potential non-viral gene delivery for HPV-16 E7 into mammalian cells. Biomater Med Devices Artif Organs 43: 1-7.
- Hosseinkhani H, Tabata Y (2006) Self-assembly of DNA nanoparticles with polycations for the delivery of genetic materials into cells. J Nanosci Nanotechnol 6: 2320-2328.
- Abdullah S, WendyYeo WY, Hosseinkhani H, Hosseinkhani M, Masrawa E, et al. (2010) Gene transfer into the lung by nanoparticle dextran-spermine/plasmid DNA complexes. Biomed Res Int 2010: 284840.
- Numata K, Kaplan DL (2016) Silk-based delivery systems of bioactive molecules. Adv Drug Deliv Rev 62: 1497-1508.
- Chomczynski P (1998) Solution containing chaotropic agent and process using it for isolation of DNA, RNA and proteins EP0843724: A2.
- Cho HK, Lone S, Kim DD (2009) Synthesis and characterization of fluorescein isothiocyanate (FITC)-labeled PEO-PCL-PEO triblock copolymers for topical delivery. Polymer 50: 2357-2364.
- Masuhiro T, Giuliano F, Yoko G (1994) Physical and chemical properties of tussah silk fibroin films. J Polym Sci B Polym Phys 32: 1407-1412.
- Haeyong K, Hwan PY (2001) Dissolution and characterization of regenerated Antheraea pernyi silk fibroin. J Appl Polym Sci 82: 750-758.
- Tsukada M, Freddi G, Kasai N (1994) Physical properties and phase separation structure of Antheraea pernyi/Bombyx mori, silk fibroin blend films. J Polym Sci Part B Polym Phys 32: 1175-1182.
- Hirabayashi K, Kondo Y, Go Y (1967) Studies on the fine structure of silk fibroin. Fiber 23: 204-207.
- Tsukada M (1986) Effect of the drying rate on the structure of tussah silk (antheraea pernyi) fibroin. J Polym Sci Part B Polym Phys 24: 457-460.
- Tsukada M, Freddi G, Monti P (1995) Structure and molecular conformation of tussah silk fibroin films: Effect of methanol. J Polym Sci Part B Polym Phys 33: 1995-2001.
- Li W, Li C (2007) Preparation and physicochemical properties of a novel hydroxyapatite/chitosan-silk fibroin composite. Carbohydr Polym 68: 740-745.
- Bodey GP, Fainstein V, Garcia I (1983) Effect of broad-spectrum cephalosporins on the microbial flora of recipients. J Infect Dis 148: 892-897.
Open Access Journals
- Aquaculture & Veterinary Science
- Chemistry & Chemical Sciences
- Clinical Sciences
- Engineering
- General Science
- Genetics & Molecular Biology
- Health Care & Nursing
- Immunology & Microbiology
- Materials Science
- Mathematics & Physics
- Medical Sciences
- Neurology & Psychiatry
- Oncology & Cancer Science
- Pharmaceutical Sciences
